Emini futures are probably the most important trading vehicle in the world.
The aim of this article is to be the ultimate introductory guide to Emini futures (and it’s been updated for 2024). There are answers to the most frequently asked questions, charts and data to show the importance of Emini futures and downloadable resources for Emini traders. Use the links below to jump to a particular section:
- What Are Emini Futures?
- What Are Micro Emini Futures?
- Why Trade Emini Futures?
- Emini vs Forex, Stocks and Options?
- Which Is the Best Emini Contract to Trade?
- How Big Is the Emini Market?
- Who Trades the Emini?
- How Do Emini Futures Work?
- What Margin Is Required to Trade the Emini?
- How Is Emini Day Trading Taxed?
- What Is the Emini Futures Symbol?
- When Do Emini Contracts Rollover and Expire in 2024?
- What Are Emini Futures Trading Hours?
- Emini Futures Trading Calendar 2024
If, after reading this article, you still have a question, get in touch, as I’d love to keep adding answers to your questions – and make this the most comprehensive Emini futures guide out there.
What Are Emini Futures?
The Emini (or E-mini, ES, or Mini) is a futures contract that tracks the S&P 500 stock market index. It is traded on the Chicago Mercantile Exchange (CME) via their Globex electronic trading platform. Trading is 23 ½ hours a day, five days a week, using the contract symbol ES.
Emini contracts are available on a wide range of US stock market indices, commodities and forex currencies. However, when traders refer to the “Emini” or “Eminis”, they are generally referring to the most important one – the futures contract that tracks the S&P 500 stock market index.
Emini futures were originally launched in September 1997 to attract non-professional investors into trading index futures. Previously, the only game in town had been the “large” (SP) contract – but it had become too expensive for the “little guy” to trade. So the CME created the Emini contract, which was 1/5th the size of the “large” S&P 500 futures contract and required 1/5th the margin to trade.
The Emini became a huge success – not only with non-professional traders but with professionals, too. With this success, the CME (and other exchanges) decided to launch over 40 other “E-mini” and “E-micro” futures contracts over the next ten years, covering:
- S&P Midcap 400 (symbol EMD)
- S&P Smallcap 600 (symbol SMC)
- NASDAQ 100 (symbol NQ, 100 largest NASDAQ companies)
- NASDAQ Composite (symbol QN, all 3,000+ NASDAQ companies)
- NASDAQ Biotech (symbol BQ)
- Dow (symbol YM, traded on CBOT exchange)
- Russell 2000 (symbol TF, traded on NYBOT/ICE exchange, small-cap index, formerly ER2 on CME)
- Russell 1000 (symbol RF2, traded on NYBOT/ICE exchange, large-cap index, formerly RS on CME)
- Metals and commodities such as Copper, Gold, Silver, Corn, Wheat, Soybeans, Natural Gas, Crude Oil, Heating Oil and Unleaded Gasoline
- Forex rates versus the US Dollar, such as the Euro, British Pound, Swiss Franc, Japanese Yen, Australian Dollar, Canadian Dollar and Chinese Renminbi
However, none of these additional contracts was as successful in attracting traders and trading volume as the “original” S&P 500 Emini contract. Then, in 2019, the CME decided to change tack and launch the Micro Emini.
What Are Micro Emini Futures?
The Micro Emini futures contract is the same as the “regular” S&P 500 Emini contract in every respect, except it is 1/10th the size. Each 1-point move in the S&P 500 index is worth $5 per Micro Emini contract, compared to $50 for the Emini (ES). And the margin to trade a Micro Emini contract is also 1/10th the size.
Typically, you need $9,200 margin to day trade a single Emini contract (Source: Interactive Brokers, January 2024). However, the Micro Emini only requires a $920 margin per contract. This should encourage new traders to try Emini trading and possibly attract Forex and Crypto day traders to switch.
The CME launched the new “Micro Emini” in May 2019 with four new contracts – one for each of the major US indices:
- Micro Emini S&P 500 (symbol MES)
- Micro Emini NASDAQ 100 (symbol MNQ)
- Micro Emini Dow (symbol MYM)
- Micro Emini Russell 2000 (symbol M2K)
The chart below shows Micro Emini (MES) trading compared to the Emini (ES) from late 2019 to 2023.
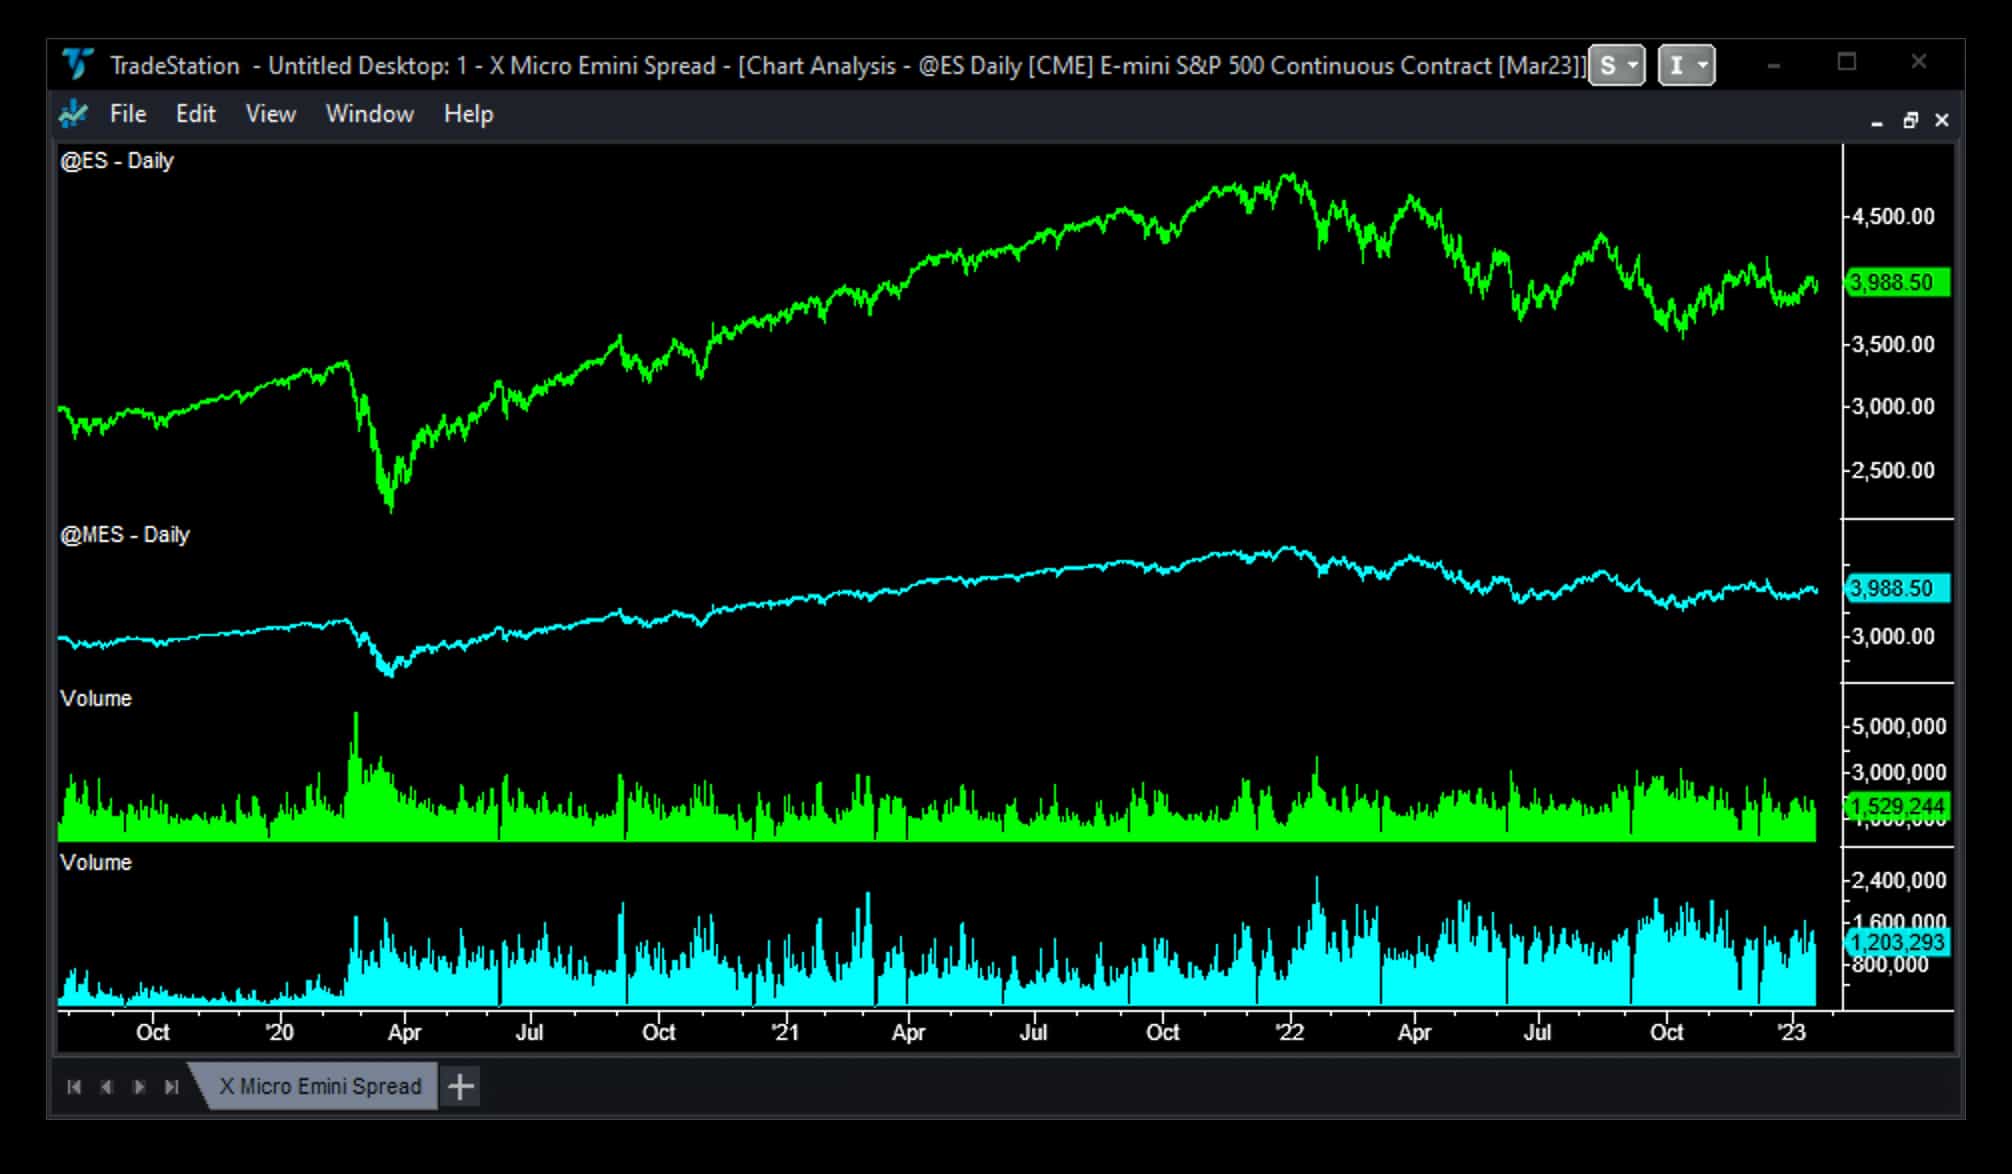
Price moves are virtually identical, with the spread being contained to 0.25 points, except on rollover days or low-volume trading holiday periods. Volumes are increasing from an average of 250k contracts per day in June/July 2019 to 1.2m contracts in January 2023. When adjusted for the difference in margin, this is approximately 10% of the daily volume traded on the Emini (ES) – up from 2% in 2019.
Why Trade Emini Futures?
- Equally easy to go Long or Short: You either buy or sell the current Emini contract, and there is no up-tick rule. If you traded the SPY ETF, you would have to buy or sell different ETFs (Long: SPY or leveraged SSO; Short: SH or leveraged SDS).
- 24-Hour trading: This makes the Emini attractive to traders around the world. Overnight moves in related equity markets, like the DAX or FTSE, can be played with one trading vehicle.
- Electronic trading platform: Your orders are entered instantaneously, and when executed, you are notified instantaneously. Changing and cancelling orders is trivial – no phone call to your broker required – and you know exactly where you stand every second you’re in a trade.
- Level playing field: The Globex electronic trading platform means that large and small traders have equal access to the market, and trades are executed in the order they are received. Unlike pit-traded futures or equities, no games can be played.
- Tight bid/ask spreads: So much volume is traded through the Emini that the difference between the bid and the ask price is only ever 1 tick or 0.25 index points – the minimum.
- Large depth of market: Again, the Emini market is so liquid there is plenty of volume on either side of the last traded price for large orders to be filled with minimum slippage (or difference from the last traded price).
- Volatile but not unmanageable: The Emini is active every day, which gives the day trader plenty of opportunity to trade. Remember, a “sleepy” market is impossible to day trade. But the Emini volatility is also manageable – except maybe around FOMC announcements – and is not driven by individual company news events.
- Low brokerage rates: Broker commissions for trading Eminis continue to fall. Interactive Brokers advertise a rate of $0.85 per contract per side (as of January 2024). This excludes exchange, clearing and regulatory fees, and when you factor those in, your “round trip” or “in-and-out” brokerage commission is closer to $4.20 per trade. TradeStation’s advertised rate is $1.50 per contract per side, but this includes the use of their excellent charting platform.
- Low margin requirement: To open a day trading position with Interactive Brokers, you need margin of $9,200 per Emini contract (as of January 2024). If you hold the position overnight, this margin requirement increases to $13,100 per contract. TradeStation has much lower margin requirements for Emini day traders of $1,300 per contract, although overnight margin requirements match Interactive Brokers. Remember, these are absolute minimums – you should be trading with much more capital behind your positions – and these margin requirements move daily based on market volatility.
- Low minimum account size requirement: The brokerage business is now so competitive, there is now no minimum dollar amount to open a futures trading account with either Interactive Brokers or TradeStation. But if you are an active stock trader you will be classified as a Pattern Day Trader and need to maintain a minimum account balance of $25,000.
- Lower tax rate than trading forex or stocks: Income from trading Emini futures is taxed at a “blended” rate of approx. 22% (60% capital gains taxed at 15% + 40% income taxed at your rates, say 33%). Gains from trading stocks or cash forex is taxed at 33%. These comments apply to US tax residents, see below for more details.
- No trade-by-trade accounting: Another advantage of the tax treatment of Emini futures is that the tax reporting requirements are minimal. In particular, no trade-by-trade accounting is required, only the net profit for the full year is needed.
Over the years, I have traded almost every possible security: stocks, options, commodities, futures, forex, mutual funds, IPOs, ETFs, cryptos, etc. But a few years ago, I finally found what I consider to be the ideal trading vehicle – the S&P 500 Emini futures. I trade it exclusively now and haven’t looked back since.
Emini vs Forex, Stocks and Options?
The section above lists a number of the advantages of Emini futures. But what about compared to trading forex, stocks, options, commodities or bonds? The video above was recorded a few years ago but still holds true. Here are the main points:
- Forex: Forex trading is very popular, but it has one big disadvantage. Volume data for forex is incomplete – there is no central forex exchange and the banks, who dominate forex trading, don’t share volume data real-time. This makes it very difficult to track average trade size and see where the Professionals are active.
- Stocks: Stock trading has two big disadvantages. Although there are literally thousands of individual stocks you could trade, 50% to 80% of the time they simply track the overall market. Plus you’re at the mercy of “event risk” – news announcements that suddenly cause prices to soar or dive.
- Options: Options trading is just too complicated – you have to get the direction of the move right, the magnitude of the move right AND the timing of the move right. Plus there are a gazillion different strategies – bull call spreads, bull put spreads, butterflies, iron butterflies, straddles, strangles, collars, calendar spreads, etc. etc. My head hurts just writing this.
- Commodities: Commodity markets are dominated by the Professionals – if you choose to trade something like Orange Juice, you’d better know your stuff (e.g. was there a frost in Florida overnight). Plus they either have too much volatility or not enough. If you’ve ever been stuck in a lock limit up or lock limit down move, you’ll know what I mean by too much volatility.
- Bonds: Lastly the granddaddy of them all. Big money and old money trades the bonds – not many Amateurs try their luck. And frankly, they’re a little bit too sleepy, for day trading at least.
Which Is the Best Emini Contract to Trade?
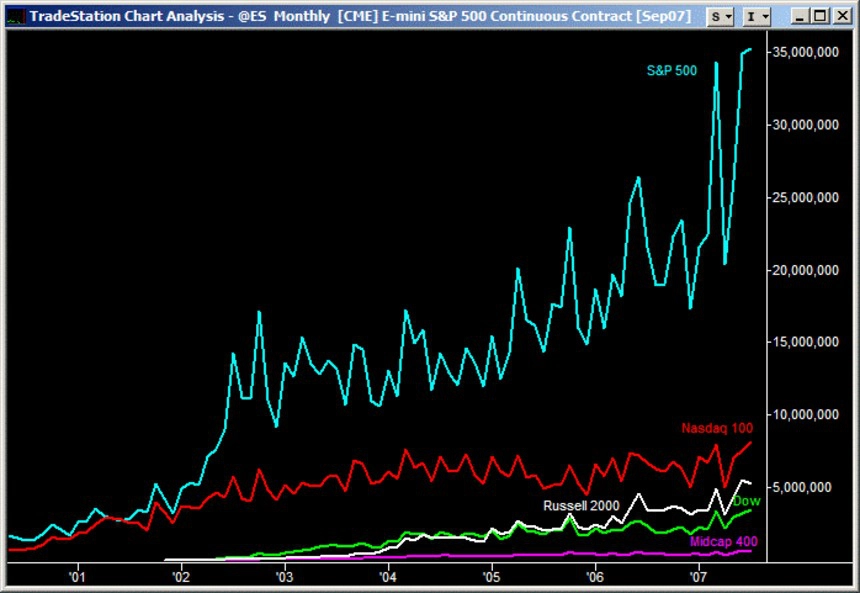
The S&P 500 Emini continues to dominate index futures as the chart above of monthly trading volumes shows. And of the 40+ “E-mini”, “E-micro” and “Micro Emini” contracts, only 10 have daily trading volumes over 1,000 contracts. Given these statistics, I wouldn’t be surprised to see the number of “E-mini” and “E-micro” contracts rationalised in the future.
So which Emini futures contract is the best to trade? IMHO the S&P 500 Emini is best, but you could also consider:
- Micro Emini (symbol MES): The MES has become a big success over the last 5 years. This smaller contract (1/10th the size of the Emini) allows new traders to try Emini trading with much less capital – $920 margin per contract, compared to $9,200 margin for an Emini contract.
- Dow (symbol YM): The YM was very popular a few years ago. Traders liked the smoother/less volatile trend moves. However, the lower liquidity meant fills were poorer and slippage greater. These days YM trading volumes are down and the “hype” has come off a little.
- NASDAQ 100 (symbol NQ): The NQ was also popular a few years ago. Traders liked the larger trend moves, as the NASDAQ index has a higher beta than the S&P 500 index. However, just like the YM, trading volumes are down and the “hype” has come off.
On this website – and when traders are talking to each other – the word Emini generally refers to the S&P 500 Emini futures contract.
How Big Is the Emini Market?
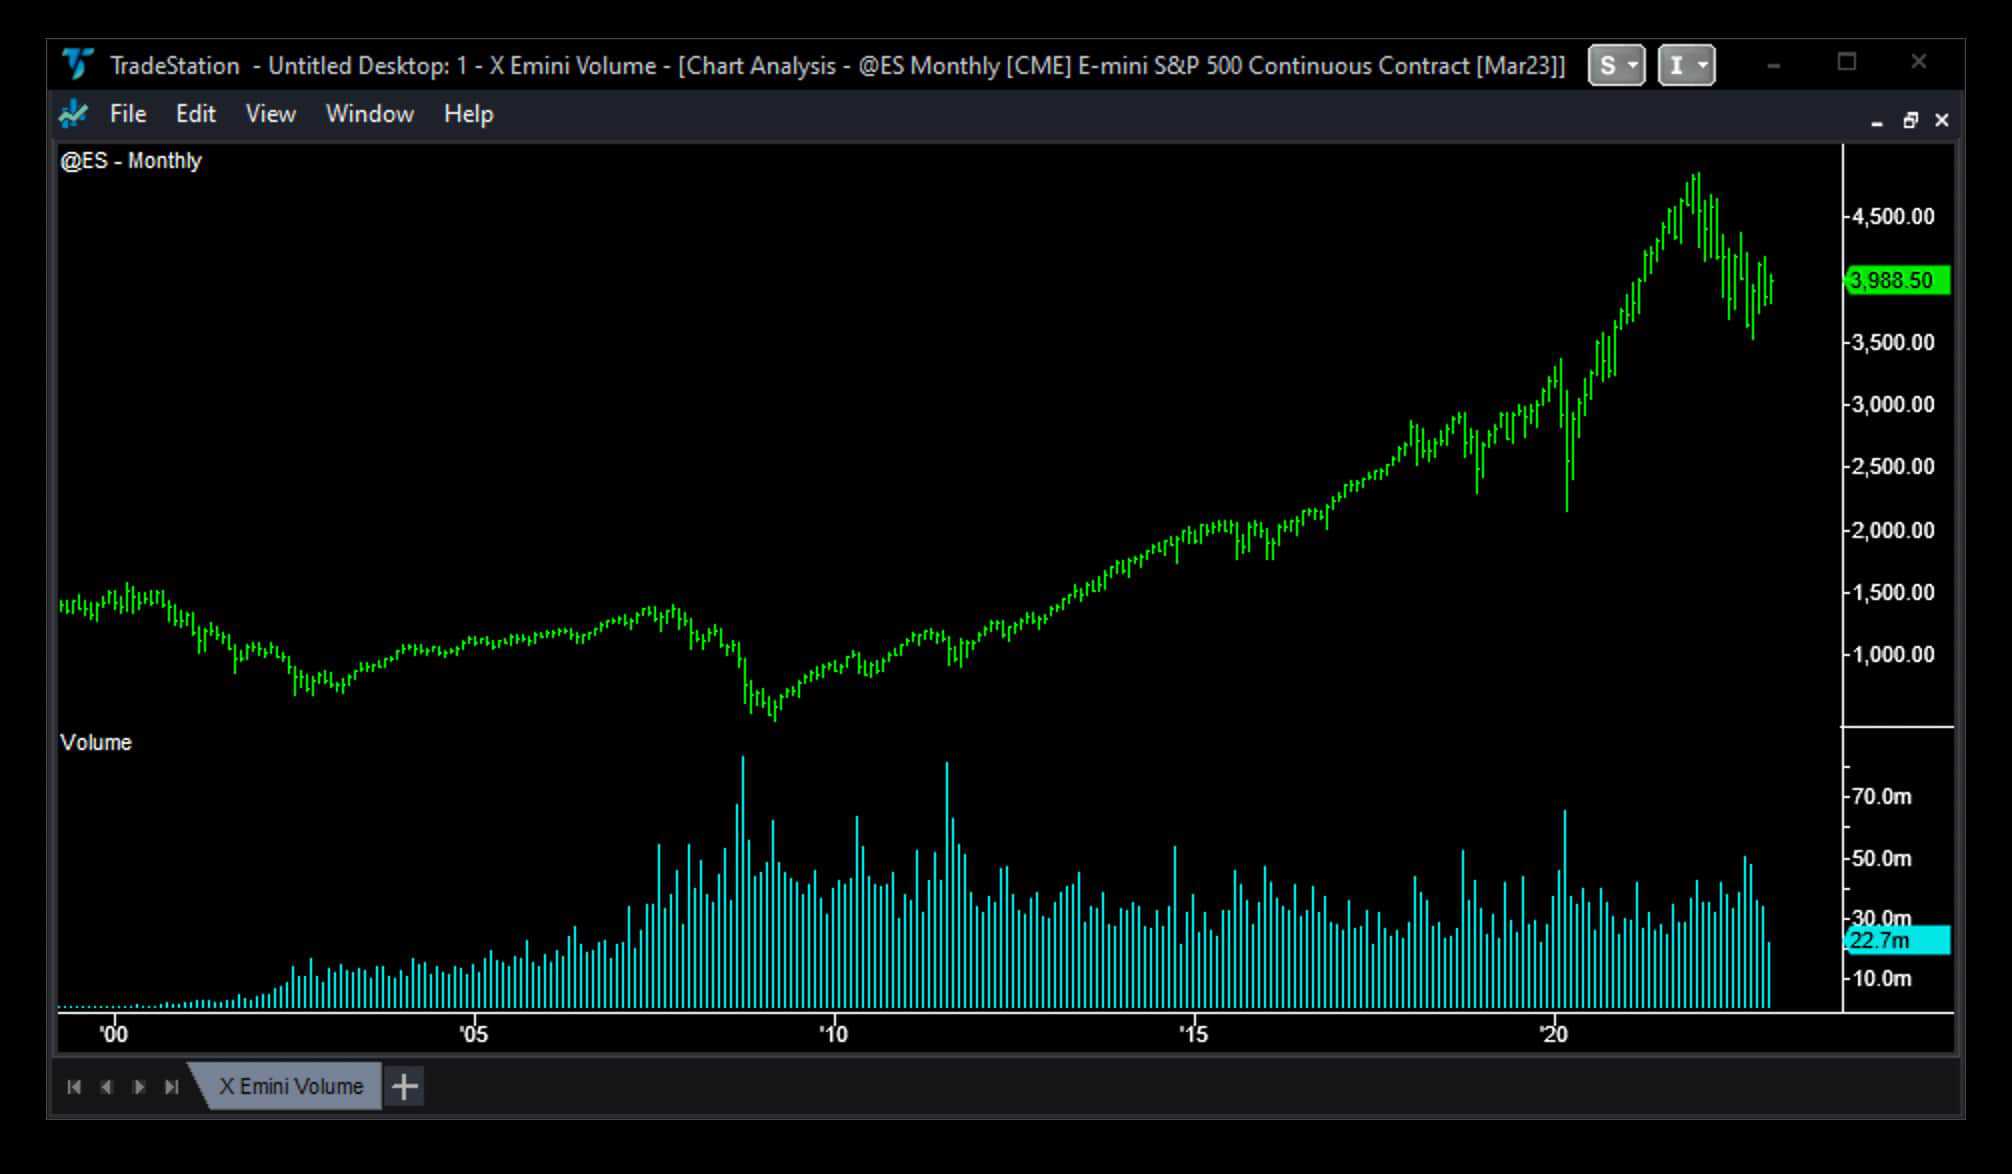
The chart above shows the growth in monthly Emini trading volumes. The huge volume spikes of over 60 million contracts traded happened during large market sell-offs in 2008, 2011 and 2020. Trading volume has been steady since 2012 and average daily trading volume is regularly over 1.2 million contracts.
So that puts the Emini in the Top 3 Largest Traded Markets in the world. Here are my estimates of the daily capital traded for each of these markets (as of a few years ago):
- SPY (S&P 500 Index ETF) = 65 m trades daily x $360 price = $23 bn in capital
- Euro/US Dollar (Spot Forex) = $78 bn total forex market x 24% Euro share = $19 bn in capital
- Emini (ES only) = 1.1 m trades daily x 2 parties x $8.5 k margin per contract = $19 bn in capital
The SPY ETF is the largest but it is more a position-taking market than a day trading vehicle, like the Emini.
Who Trades the Emini?
Everyone trades the Emini! Mutual funds, pension funds, hedge funds, insurance companies, high-frequency trading (HFT) firms, trading syndicates, professional traders and individual/non-professional traders.
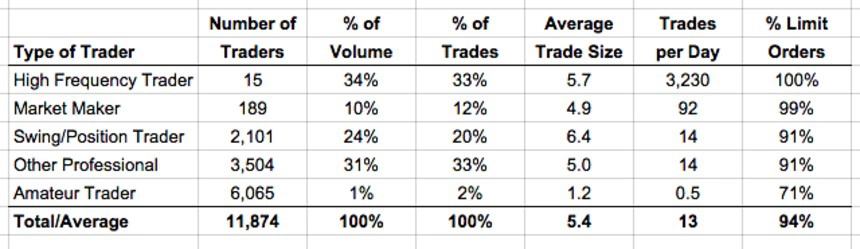
The chart above shows Emini trading volume by type of trader in 2010:
- 15 High-Frequency Trading (HFT) firms account for one-third of the total Emini market.
- 5,800 Professional traders (either day trading or position trading, i.e. holding overnight) account for the other two-thirds of the market.
- 6,000 Amateur traders (trading on average 1 contract per trade and 1 trade every other day) account for only 1% of the total Emini trading volume.
Source: “Findings Regarding the Market Events of 6 May 2010” Joint Report of CFTC & SEC, 30 Sept 2010, page 29.
How Do Emini Futures Work?
The first thing you need is a futures brokerage account. This is different from a “normal” stock trading account – because it’s governed by different regulations – but works in the same way. Interactive Brokers are an excellent option. I particularly like that they’re geared around being 100% online – for example, their application process is 100% electronic. But they’re not the only option.
Having your brokerage account linked with your charting platform provider is a very cost-effective way to go. Both TradeStation and NinjaTrader, the leading charting platforms, now offer futures brokerage services.
The second thing you need is a charting platform and trading methodology. There are dozens of different charting platforms (I’ve reviewed the major options here) and hundreds, if not thousands, of different trading methodologies (here’s how I trade).
Let’s assume you’re following the Emini market on your charting platform and your trading methodology has given you a signal to buy – or “go Long” – the market.
At this stage, you might have funded your futures brokerage account and have some initial capital you want to trade. Or you might be “paper trading” and using the trading simulator functionality of your broker to place trades. Either way, you enter a Buy order in your broker’s order entry screen – choosing an “at market” order (which will get you in straight away at the “ask” price) or a “limit” order (which will get you in when your order at the price you’ve nominated gets hit) of the current Emini futures contract.
The number of contracts you place an order for will depend on the size of your account, your broker’s margin requirements and your risk tolerance. You should immediately place your profit target and stop loss orders (each around 10 points in today’s market).
Assuming you got the trend direction right, your profit target will be hit and you will make 10 points profit, less brokerage commissions. 10 Emini points equals $500 per contract traded. Brokerage commissions are approximately $4 per contract traded, so you net profit is $496 per contract. If you have a $30,000 account you might be trading 2 Emini contracts and so your net profit would be $992:
((10 x $50) – $4) x 2 = $992
If you got the trend direction wrong, your stop loss order would be hit and your loss would be $1,008:
((10 x -$50) – $4) x 2 = -$1,008
Once you’re out of the trade, make sure any outstanding orders are cancelled. If your profit target got hit, make sure your stop loss order is cancelled. If your stop loss got hit, make sure your profit target order is cancelled. At the end of the day, your broker should email you a statement with any trades taken during the day – check the statement to confirm your daily net profit/loss and make sure you’re “flat” (i.e. not holding any outstanding positions).
What Margin Is Required to Trade the Emini?
The answer to this question depends on the futures broker you choose to trade through. And there are 3 different $ amounts that matter:
- Intraday Initial Margin: The amount you need in your account to place an Emini day trading order. Varies between approx. $1,300 and $9,200, depending on your broker and current market volatility.
- Overnight Initial Margin: The amount you need in your account to place an Emini trade during the overnight or after-hours session. This varies but is approx. $13,100, again depending on your broker and current market volatility.
- Minimum to Open Account: The amount you need to open a futures trading account. Varies between $1 and $10,000, depending on your broker.
Most traders, when they start out, want to know what is the minimum capital they need to start day trading. Although the ‘Intraday Initial Margin’ amount might only be $1,300, the real minimum is the amount you are likely to draw down before you become consistently profitable.
But rather than jumping in straight away and opening an account to day trade futures, you’re much better off paper trading or trading on a simulator account first.
How Is Emini Day Trading Taxed?
Emini futures are taxed at an attractive tax rate – a “blended” rate of 60% of your (lower) long-term capital gains rate + 40% of your (higher) ordinary income tax rate. For most traders, this equates to a rate of between 19% and 22%. The actual tax rate you pay will depend on your total income.
On the other hand, if you trade stocks or forex your short-term capital gains are taxed as ordinary income – which for most traders is a tax rate of between 25% and 33%. You only pay the (lower) long-term capital gains rate if you hold stocks for more than 1 year.
Your actual tax rate for trading Emini futures will depend on your total income and resulting (marginal) tax bracket. For example:
- Total income less than $100k: 60% at long-term capital gains rate of 15% + 40% at the ordinary income tax rate of 25% = 19% tax rate.
- Total income $100k to $200k: 60% at long-term capital gains rate of 15% + 40% at the ordinary income tax rate of 28% = 20.2% tax rate.
- Total income $200k to $400k: 60% at long-term capital gains rate of 15% + 40% at the ordinary income tax rate of 33% = 22.2% tax rate.
In addition, Emini traders have a much easier time doing their taxes at year end. Stock traders have to report every single trade they make – Emini traders only have to report their net profits for the year. Your broker will send you an IRS form 1099-B at year end and you just transfer this one number (IRC Section 1256 contracts) to IRS form 6781 in your income tax return. If you hold any futures position over the year end cut-off, your broker will automatically mark it to market and calculate the realized plus un-realized profits.
Lastly, Emini futures trading losses can be “carried back”. This means that any trading losses you incur in this current year can be used to get a tax refund on taxes paid on profits made in a previous year. This “carryback” can be applied to trading profits for the last 3 years, by filing IRS form 1040-X or form 1045. Any trading losses that you do not “carryback” can be “carried forward” indefinitely.
What Is the Emini Futures Symbol?
The Emini futures symbol is ES and each Emini contract is denoted by ES plus a code for expiration month and year. Emini futures expire quarterly in March, June, September and December and these are denoted by the letters “H”, “M”, “U” and “Z” respectively. So ES24H (or ESH24) is the contract symbol for an Emini S&P 500 futures contract that expires in March of 2024.
Here are the Emini futures symbols for 2024:
- March 2024 contract: ES24H (or ESH24)
- June 2024 contract: ES24M (or ESM24)
- September 2024 contract: ES24U (or ESU24)
- December 2024 contract: ES24Z (or ESZ24)
To make things easier you can also chart a “continuous” contract on most charting platforms. Data providers join together (or concatenate) symbols from adjoining quarters so you can plot a long history of each contract. In TradeStation, the continuous Emini futures contract has a symbol of @ES.
When Do Emini Contracts Rollover and Expire in 2024?

Emini contracts “rollover” (to the next active contract) and then “expire” every quarter.
Contract expiry is on the 3rd Friday of March, June, September and December. However, contract rollover – when the majority of trading moves to the next contract – is the far more important date.
Contract rollover is on the 2nd Thursday of March, June, September and December, unless the rollover month starts on a Friday, in which case it is on the 1st Thursday of the month.
Contract rollover is more important than contract expiry because that’s when the majority of trading moves from the old contract to the new (or “front”) contract. Here are the Emini futures contract rollover dates for 2024:
- Thursday 7 December 2023: Rollover to the March 2024 contract
- Thursday 7 March 2024: Rollover to the June 2024 contract
- Thursday 13 June 2024: Rollover to the September 2024 contract
- Thursday 12 September 2024: Rollover to the December 2024 contract
- Thursday 12 December 2024: Rollover to the March 2025 contract
Note: Forex futures traded on the CME Globex platform (i.e. EC, JY, etc.) usually rollover on the Monday prior to the Emini stock index futures (i.e. ES) rolling over.
However, on Rollover day itself most trading volume is still traded on the “old” contract – it’s not until the next day that traders move to the “new” contract. So I recommend you adjust your charts on Rollover day to show the “old” contract and take your signals on that. Alternatively, don’t trade Rollover day at all, you’ll only miss four trade days a year by doing that.
Emini futures do “settle” at the end of each quarter, but most traders have liquidated their positions in the “old” contract and moved on to the “new” contract. If you happen to be holding an Emini futures position at settlement time, your trading account is credited any profit (or debited any loss) on that contract and your position closed out. Unlike commodity futures like Copper or Crude Oil, physical delivery on settlement doesn’t exist for financial futures contracts like the Emini.
What Are Emini Futures Trading Hours?
Emini futures trading hours are almost 24/5. Weekly trading of the Emini opens on Sunday at 5pm (CST) and closes on Friday at 4pm. Trading is almost 24 hours a day with a break every day between 4pm and 5pm for scheduled maintenance.
Trade is broken into two sessions, the Day session and the After-hours session:
- Day session trading starts at 8:30am and finishes at 3:15pm (CST)
- After-hours trading starts at 3:15pm, stops for an hour between 4pm and 5pm and then resumes until the open of the next Day session at 8:30am
The greatest activity and volume traded obviously happens during the Day session. However, data releases before the Day session open can often generate large activity, as can any important news out of Asia or Europe.
Emini Futures Trading Calendar 2024
The Emini follows the normal stock market holidays. Here is the Emini futures holiday schedule for 2024:
- Monday 15 January 2024: Martin Luther King Jr Day
- Monday 19 February 2024: President’s Day
- Friday 29 March 2024: Good Friday
- Monday 27 May 2024: Memorial Day
- Wednesday 19 June 2024: Juneteenth Day
- Thursday 4 July 2024: Independence Day
- Monday 2 September 2024: Labor Day
- Thursday 28 November 2024: Thanksgiving Day
- Wednesday 25 December 2024: Christmas Day
- Monday 1 January 2025: New Year’s Day
And you can always find the exact holiday trading hours and Open and Close times on the CME Group website here. Here is the Emini-Watch public calendar with important Emini trading dates:
If you use Google Calendar, just hit the “+” button (bottom right on the calendar below) and it will import this Emini trading calendar into your personal Google Calendar. The calendar can also be imported into other calendar applications using these links: iCal format and HTML format.
I hope you found this feature article on S&P 500 Emini futures helpful.