This (long) article describes, in detail, how I day trade Emini futures and what works for me.
It’s divided into more than two dozen question and answer sections, so use the links below to jump to the Emini trading topics that interest you:
At the end of each section are links to videos and articles with (even) more information. These links showcase the best of Emini-Watch, so use this page as a Table of Contents for the whole website.
And remember, as you read this article …
Absorb what is useful, discard what is useless and add what is uniquely your own. Bruce Lee
To start with I should explain that my trading is “discretionary” rather than “systematic”.
All trading exists on a spectrum: from “seat of your pants” and “gut feel” at one extreme to “pure” trading bots and automated trading systems on the other extreme. I have a methodology based on 3 non-correlated indicators and trade in a disciplined and rule-based way, but I don’t follow specific coded signals for my entries and exits.
So that puts my trading right in the middle of the spectrum. Maybe one day my indicators will evolve into entry and exit signals – taking opinion and emotion out of trading is always a good thing – but for now I identify and evaluate setups “visually”.
Why Trade Emini Futures?
Today, day traders have an almost unlimited number of markets (or vehicles) to trade. For example, you could trade:
- Commodities (like crude oil, soybeans and copper)
- Precious metals (like gold, silver and platinum)
- Currencies or Forex (like US dollar index, euro and yen)
- Cryptocurrencies (like bitcoin, ethereum and ripple)
- Individual stocks (like Apple, Tesla and Microsoft)
- Stock market index futures (like the Emini, Nasdaq, SPY and DAX)
- Options or leveraged ETFs on any of the markets above, etc.
The ideal trading vehicle has the perfect mix of:
- Volatility
- Liquidity
- Simplicity, and
- “Electricity”
You need a market that moves a fair bit during the day (volatility). You want plenty of participants to make sure the market isn’t rigged, you can get in and out easily and bid/ask spreads are narrow (liquidity). You don’t want it to be overly complicated – simple long/short decision with minimum of trading vehicle options (simplicity). And lastly, you want the vehicle to be traded on a single electronic exchange (“electricity”).
All the markets above have their different pros and cons. But what I’ve found is that S&P 500 stock market index futures – the Emini – has the best mix of volatility, liquidity, simplicity and “electricity”.
Then in May 2019, the CME made the Emini market even more attractive, when they launched the Micro Emini contract. This new contract is identical to the “regular” Emini contract, except it is 1/10th the size. The margin needed to trade 1 Emini contract is typically US$4,250. But the margin to trade 1 Micro Emini contract is only US$425. Which makes this a very attractive option for new traders.
And lastly a note about trading bitcoin.
Cryptocurrencies have become hugely popular in the last few years (although recent analysis indicates actual trading volumes are far less than reported). The result is that there are currently 23 crypto exchanges where you can trade bitcoin. But there are large price discrepancies between the exchanges, which shows the market is not efficient and so, from a trader’s perspective, not ideal. But things will improve, so it’s worth keeping an eye on bitcoin and the crypto markets.
Why Is Emini Day Trading So Hard?
I don’t think trading any market is easy. But is Emini trading any harder than other markets? I don’t think so. All large, volatile, liquid markets – like the Emini – attract Professional and Amateur traders alike. And the daily activity you see is the Professionals systematically profiting from the Amateurs by:
- Scaring the Amateurs out of their positions with sharp counter moves
- Re-testing new Lows and new Highs to trigger stops placed at these obvious spots
- Moving trend breakouts quickly so there are no easy retracements to jump on board
- Suckering Amateurs into trading quiet days and buying breakouts that fizzle, etc.
But I think three other characteristics of the Emini market are worth mentioning:
- The growth of high frequency trading bots, that profit from very short term imbalances around the bid/ask, has made the Emini “twitchier” and less “smooth”
- Every 2 or 3 years the Emini market seems to change “character” and just feels different – just when you thought you were getting into your trading groove, what used to work just stops working, and
- As with all markets, volatility comes and goes and quiet markets are always harder to trade (2017 was a rough year but 2018 and 2019 have made up for it)
Ultimately, nothing worth doing is easy – and that’s true for every profession or pastime. So if you want to trade with the Pros, you just have to get used to the Emini’s personal characteristics.
How Much Capital Do You Need to Start Day Trading Futures?
Theoretically, you can start day trading Emini futures with capital of US$4,250 and Micro Emini futures with capital of US$425. This is the initial margin required to trade 1 contract. However, in practice, you’ll want to use 2-3 times that amount: so US$10,000 for the Emini and US$1,000 for the Micro Emini.
In previous years the futures account ‘opening minimum’ used to be the primary consideration. Interactive Brokers, for example, used to have an opening minimum deposit of US$10,000 for a futures account. Although this was less than the minimum for day trading stocks (US$25,000) it was much more than the minimum required for forex day trading. As a result, new traders gravitated towards forex.
These days, account minimums are being dropped. Interactive Brokers no longer advertises an account minimum, TradeStation has dropped theirs to US$500 and NinjaTrader’s is US$400. It looks like the competition from forex brokers – and now Cryptocurrency exchanges – is having an impact and benefiting the small trader.
What Are the Best Emini Trading Indicators?
First of all, I don’t trade using “traditional” technical analysis. Technical analysis typically uses price-based indicators – trend lines, moving averages, Elliott waves, head and shoulder patterns – to predict what the price of an instrument or market will do.
I don’t believe that you can use price history (alone) to predict future prices. Yes, I use a price indicator to analyse price movement but it’s only 1 of the 3 indicators I use.
Remember, modern data feeds from the exchanges give you 3 pieces of real-time data:
- The price a trade was executed at
- The size or volume of the trade, and
- Whether the trade hit the bid or the ask price
Almost all traders are ignoring 2 of these 3 pieces of data and basing their trades on price alone – using multiple, correlated, price-based indicators. That’s crazy!
There’s insight to be gained by looking at the trade size and whether the bid or the ask was hit. For example, if a “whale” (or Professional) steps in and sells 200 contracts at the bid, that’s important. But if it’s 40 small to medium sized (1 to 10 contract) trades that go through, with half hitting the bid and half hitting the offer, well that’s less telling. Using price analysis alone these 2 scenarios could look identical on a price chart – but be totally different in terms of what they mean for price direction in the next 10-30 minutes.
I want to understand ALL the available data and so use 3 non-correlated indicators:
- Better Sine Wave that is based on price
- Better Momentum that measures volume traded at the bid or ask, and
- Better Pro Am that analyses the average trade size (and separates the Professional traders from the Amateurs)
Better Sine Wave Indicator
So let’s start with my price indicator, Better Sine Wave.
Typically price-based indicators fall into one of 2 types:
- Oscillators (like RSI, Stochastic, CCI, etc.), and
- Moving average based (like EMA, MACD, Bollinger Bands, etc.)
Oscillators are great when price is bouncing between Support and Resistance levels – but are lousy when a trend develops and they just hit their maximum reading and stay there. Moving average based indicators are great when price is trending up or down – but are lousy when the market is in consolidation and they just whipsaw with false signals.
What you need is a price-based indicator that works in both the trending and consolidation phases of the market. And this is where Better Sine Wave steps in.
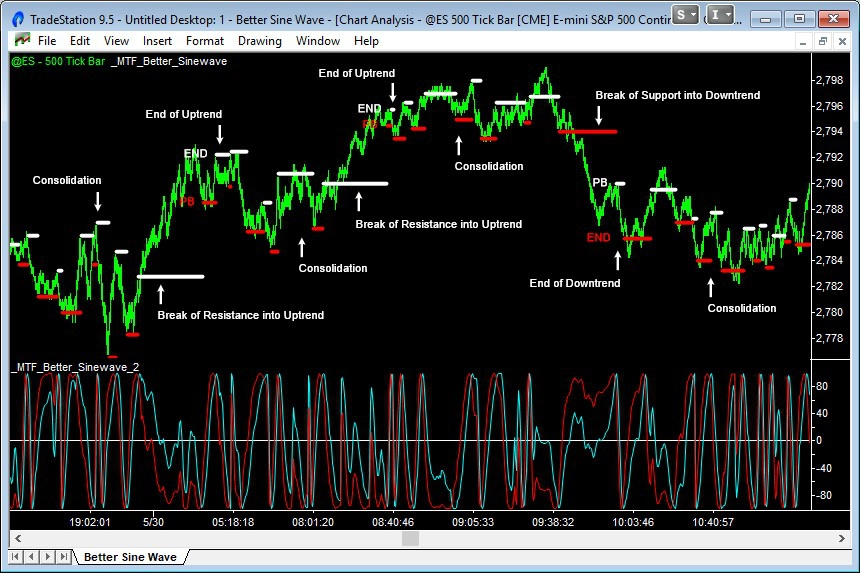
Better Sine Wave is based on an algorithm developed by John Ehlers (a true genius who has given so much to the trading world) that determines the cyclical state of a market. When price is in consolidation, it bounces between Support and Resistance and is in a cyclical state. But when price breaks these cyclical Support or Resistance levels, then it is in a trending state.
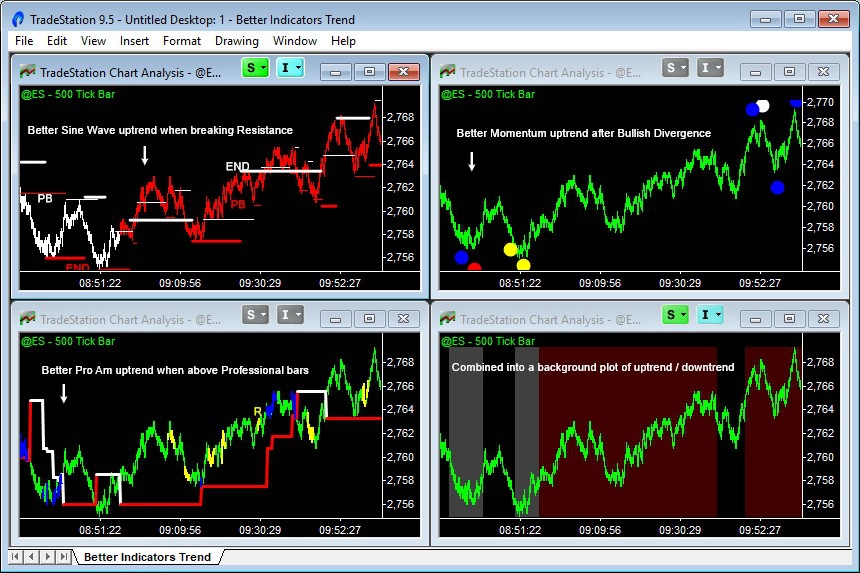
In the chart above, the cyclical or trending state is being shown in the second indicator panel, below the price bars. It shows 2 lines oscillating backwards and forwards in a regular pattern when in consolidation and oscillating irregularly when price breaks into a trend. Then these consolidation and trending phases of the market are shown, with cyclical Support and Resistance levels on the price bars themselves.
What we want to trade are the breakouts into trends – and we want to avoid the consolidation periods where the market is going nowhere. So trade:
- Breaks above cyclical Resistance into an Uptrend (and go Long), or
- Breaks below cyclical Support into a Downtrend (and go Short)
Read on to find out how I use my other 2 indicators (non-price based) to identify these breakouts and high probability trades.
Better Momentum Indicator
So to the next indicator, Better Momentum, which measures the strength of buying and selling volume – or volume momentum.
The trend of a market is determined by buying and selling volume. When buying volume overwhelms selling volume, prices increase and the trend is up. When selling volume overwhelms buying volume, prices decrease and the trend is down.
The trend only changes when all the sellers have sold – in the case of a market reversing from downtrend to uptrend. And when all the buyers have bought – in the case of a market reversing from uptrend to downtrend.
When everyone rushes to one side of the boat, head to the other side to avoid getting soaked. Anonymous investor
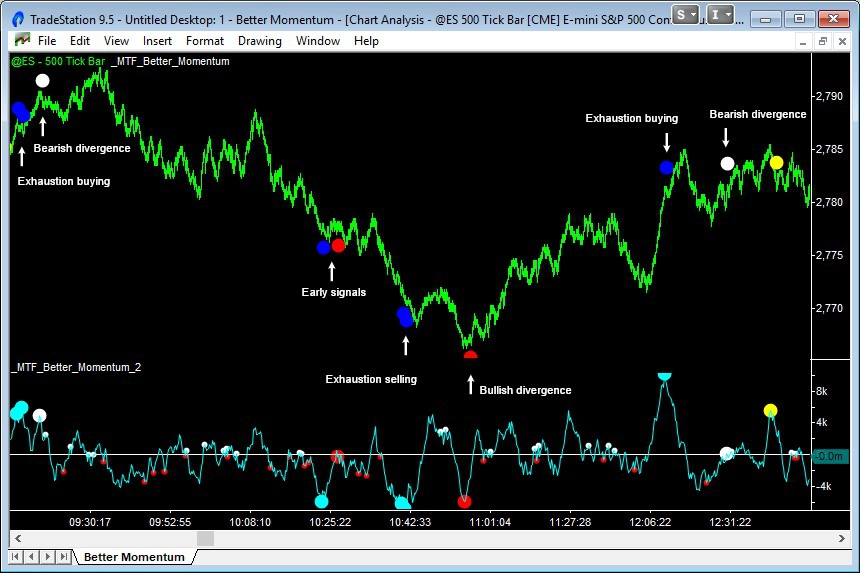
Better Momentum measures these Exhaustion volume patterns that occur when all the buyers have finally bought or when all the sellers have finally sold. The chart above shows these Exhaustion patterns with big blue dots above or below the price bars. They’re also shown on the volume momentum line in the second indicator panel, below the price bars.
The market will then start to reverse when we see Divergence patterns, where the buying or selling volume weakens. Bullish Divergence patterns are shown with big red dots below the price bars – and warn that you should be anticipating a change in trend from down to up. Bearish Divergence patterns are shown with big white dots above the price bars – and warn that you should be anticipating a change in trend from up to down.
The Exhaustion volume patterns are always the first to signal a change in trend. And sometime the Bullish and Bearish Divergence patterns catch the absolute peak or trough in a market. But before taking a trade I look for one more thing – confirmation that the Professionals are getting in and anticipating a change in trend.
And that’s where Better Pro Am, my third indicator, comes in.
Better Pro Am Indicator
Better Pro Am is really my baby – my favourite indicator. A unique little creation. Such a simple concept, but never been done before (to my knowledge).
It measures average trade size and from that determines whether Professionals or Amateurs are trading. The average trade size spikes up around 20% when the Professionals are active; and the average trade size dips down around 20% when the Amateurs are active.
Follow the Professionals and fade the Amateurs. Emini-Watch.com
Years ago I read everything I could about trading, technical analysis, indicators, coding – I must have almost 100 books on trading, all packed away in storage now. But no one ever mentioned average trade size, at least not in anything I ever read. Incredible really – is it possible I was the first to stumble on this idea? And so Better Pro Am was born.
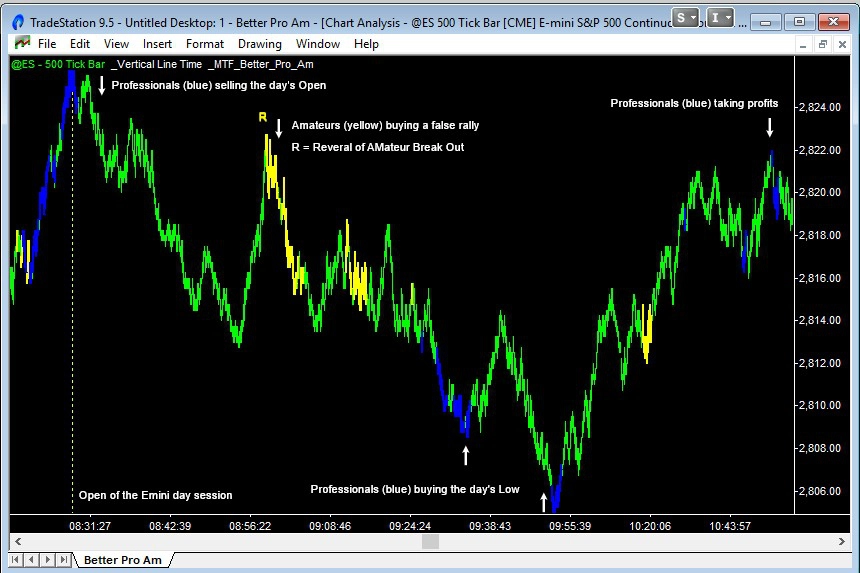
Better Pro Am signals:
- Professional activity with blue bars
- Amateur activity with yellow bars, and
- RAMBO patterns (Reversal of AMateur Break Out) with “R” text
In your Emini trading, you should follow the Professionals and fade (do the opposite of) the Amateurs. In this regard, the RAMBO pattern is particularly useful – it signals at a price extreme where the move is likely to fail and reverse. So watch out for those.
And the last point about Better Pro Am. The Professionals “leg” into and out of positions. They are moving so much volume, they can’t just put all their position on at once or take it all off. They set price levels at which they start to accumulate a position – and if as price moves down to another level they buy some more. Similarly, when taking profits they liquidate some of their position when an initial price target is met with resting sell orders – and as price moves further up their stretch targets get hit.
So look for those “legs” of Professional activity – not just one signal where the Professionals are 100% long, 100% short or 100% flat.
How to Determine the Trend Direction
Are you fighting the trend? Profits will come easily if you trade with the trend. Emini-Watch.com
So now let’s talk about using the 3 Better Indicators to determine the market trend – as each indicator uses a different method to define the trend.
- Better Sine Wave: An uptrend is in play when price moves strongly to the upside and consistently breaks above Resistance levels. Similarly, a downtrend is in play when price moves strongly to the downside and consistently breaks below Support levels.
- Better Momentum: An uptrend is likely after Exhaustion selling and a Bullish Divergence signal (big red dot) is plotted. Similarly, a downtrend is likely after Exhaustion buying and a Bearish Divergence signal (big white dot) is plotted.
- Better Pro Am: An uptrend is in play when price is above a cluster of blue Professional bars. Similarly, a downtrend is in play when price is below a cluster of blue Professional bars. A support/resistance line is trailed behind these clusters of Professional bars and flips from uptrend to downtrend when broken.
Uptrends and downtrends using these 3 methods are shown in the chart above.
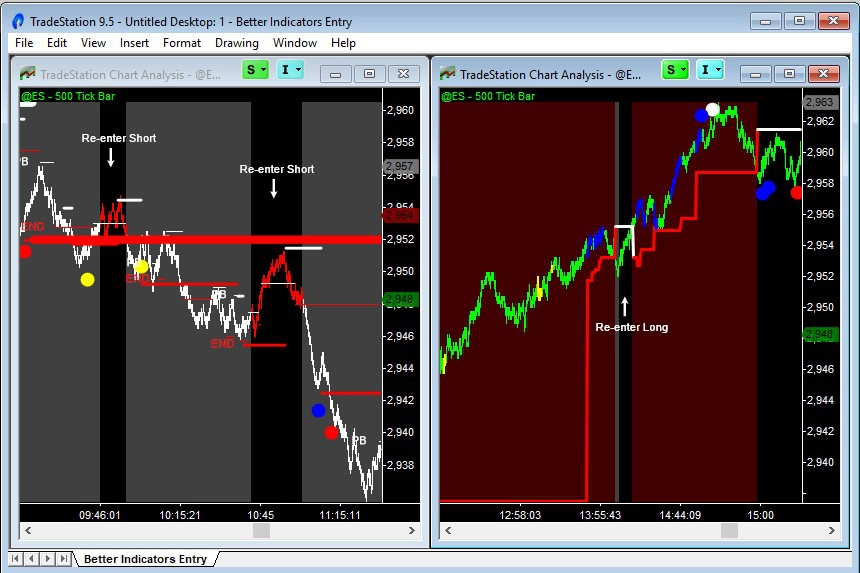
In addition, I combine the Better Sine Wave and Better Pro Am trend calculations to create a “combo” trend indicator – this colors the chart background grey for downtrends and dark red for uptrends. This “combo” trend is shown in the bottom right hand chart in the image above.
Why Use Multiple Timeframes for Emini Trading?
This concept is probably best explained with a video, so check out the links at the end of this section. But anyway, here goes.
The reason why indicators with fixed lookback periods don’t work is that trend lengths change. Sometimes a trend move will last for 20 bars, sometimes 50 bars and sometimes over 100 bars. If you have a stochastic oscillator tuned for 20 bar trend moves, then it will become horribly over-bought with 50 and 100 bar trend moves. Alternatively, if you have a moving average tuned for 100 bar moves, then it won’t catch the start of a 20 bar trend move and will be horribly late with a 50 bar move.
The answer is to look at multiple timeframes simultaneously and measure if the trend move is:
- Weak (or short) and working in the lowest timeframe
- Normal and working in the intermediate timeframe, or
- Strong (or long) and working in the highest timeframe
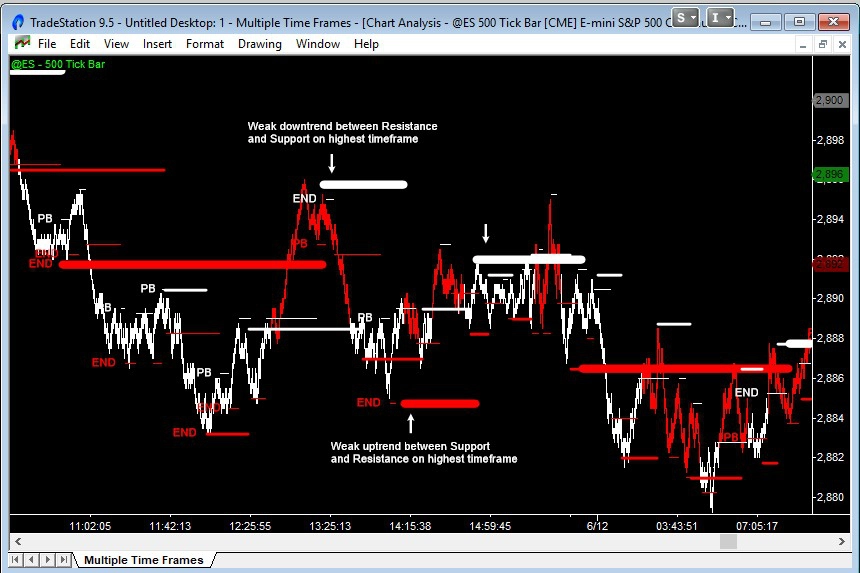
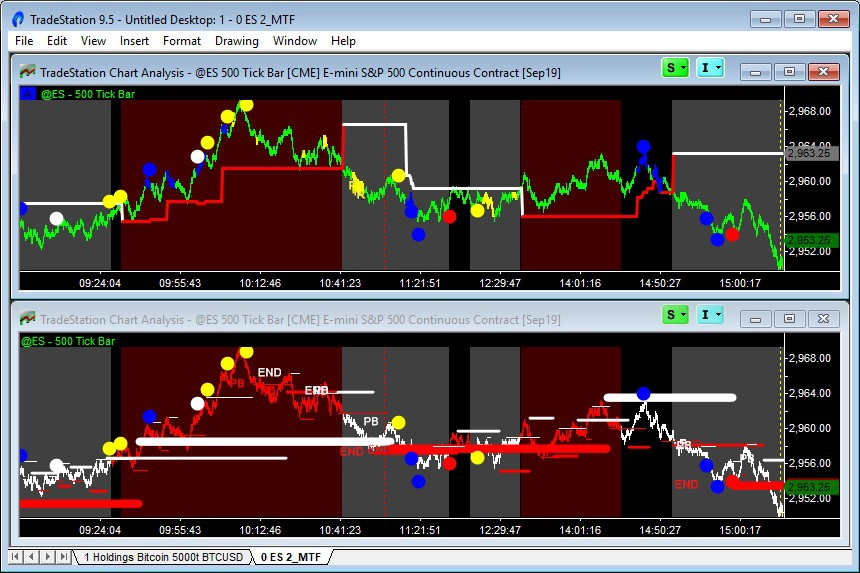
Better Sine Wave is perfect for measuring these trend moves in 3 different timeframes. A weak trend move will cycle between Support and Resistance lines in the highest timeframe (thick red and white lines) and ideally signal “End of Trend” in the lowest timeframe at these turning points. Two weak trend moves are shown in the Emini trading chart below:
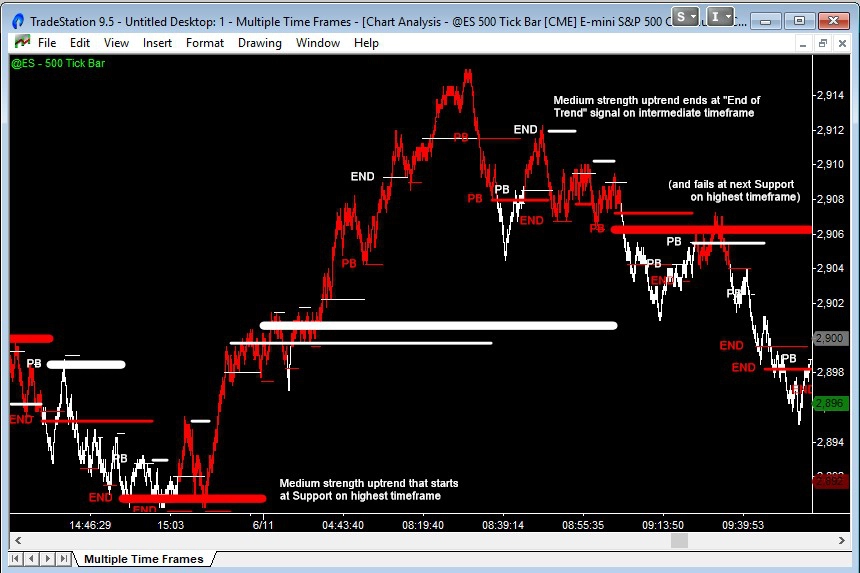
A more normal trend move might start at Support in the highest timeframe (thick red line) and overshoot Resistance in the highest timeframe (thick white line). Then play out until an “End of Trend” signal in the intermediate timeframe (medium thickness red and white lines). A normal trend move, working in the intermediate timeframe, is shown in the next Emini trading chart:
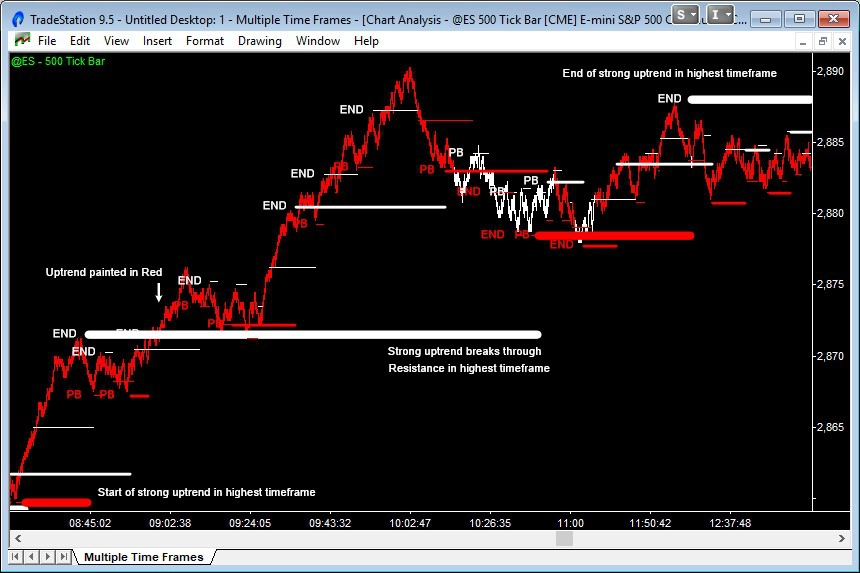
Lastly, a strong trend move might start at Support in the highest timeframe (thick red line), break through the next Resistance in this highest timeframe (thick white line) and go on to play out an “End of Trend” signal in the highest timeframe. A strong trend move, working in the highest timeframe, is shown in this Emini trading chart:
Why Use Tick Charts for Day Trading?
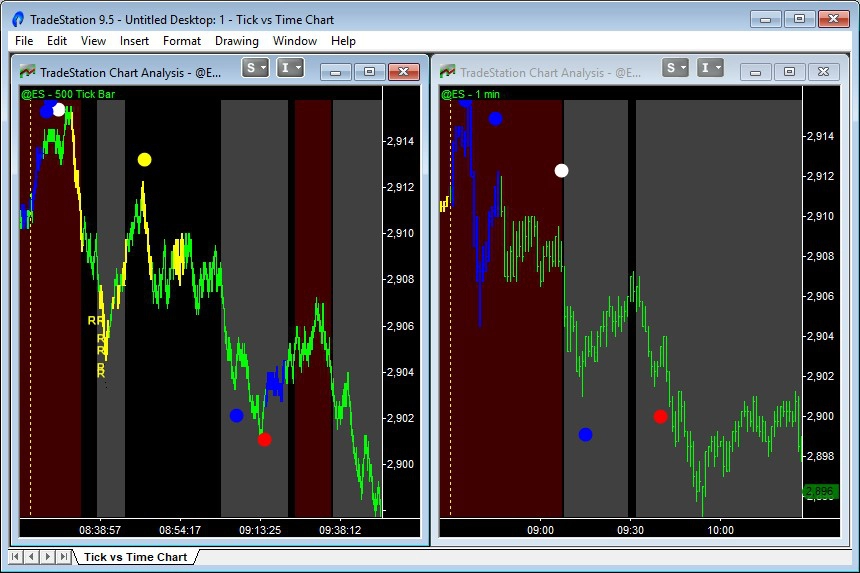
Years ago tick charts were virtually unknown, but today they’ve become much more popular – and for good reason. First of all a definition.
Conventional (i.e. time-based) charts draw a new bar after a set period of time, for example after every 5 minutes. Tick charts draw a new bar after a set number of trades, for example after every 500 trades.
I’m not going to say that tick charts alone will supercharge your trading and lead to guaranteed, day trading profits. After all, it’s just a different way to construct a chart and view the market based on activity, rather than time. But tick charts do help signal accuracy:
- Tick charts compress low activity periods: So overnight activity can be viewed fairly and not distort the “real” market that happens after the day’s Open. For example, a moving average will take a while to re-calibrate at the Open because it’s lookback is full of low activity bars.
- Tick charts let you see high activity periods more clearly: When the market is running fast, for example during FOMC announcements, a tick bar chart will quickly follow what is happening. A time-based chart will mask the real activity because it’s compressed into fewer bars.
- Tick charts identify Professional activity more accurately: A tick chart can easily be used to analyse average trade size and, therefore, identify Professional and Amateur activity. You can achieve the same calculations on a time-based chart, but the accuracy is diminished.
- Tick charts let you “see” more cyclical information: The cycles plotted by Better Sine Wave are definitely more accurate on tick charts. And since my Emini trading relies heavily on identifying cycles and break outs of these cycles into trend moves, I favour tick charts.
And now for the bad news about tick charts.
Tick charts will never match between different data providers. This is just a fact of life, I’m afraid. Different data providers “scrub” individual trade data differently. Sometimes trades are split, sometimes aggregated based on different rules that the data providers use, all in an effort to make their data “more accurate” or faster to transmit.
The situation is not ideal – it just means you can’t go cheap when selecting your data provider.
How to Set up Your Emini Charts?
So then, this is how I put it all together.
- Start with two 500 tick bar charts of the Emini
- Use the continuous, day & night Emini contract (symbol @ES on TradeStation)
- Load 5,000 bars of back history (my default setting)
- The two charts can either be on top of each other or side-by-side
- On the top chart I have Better Pro Am (with alerts for Professional bars turned on)
- On the bottom chart I have Better Sine Wave
- On both charts I have Better Momentum and the Combo trend (red and grey background)
- On both charts I have the ‘Vertical Line Time‘ indicator showing the Open, Close and 11am Window
- All indicators are set to ‘Calculate on bar close’
I’m always looking to simplify my charts – you’ll see the chart setup evolving in the trading blog – but I’ve stuck with this combination for a while now and I’m pretty happy with it.
What Does a Typical Entry Signal Look Like?
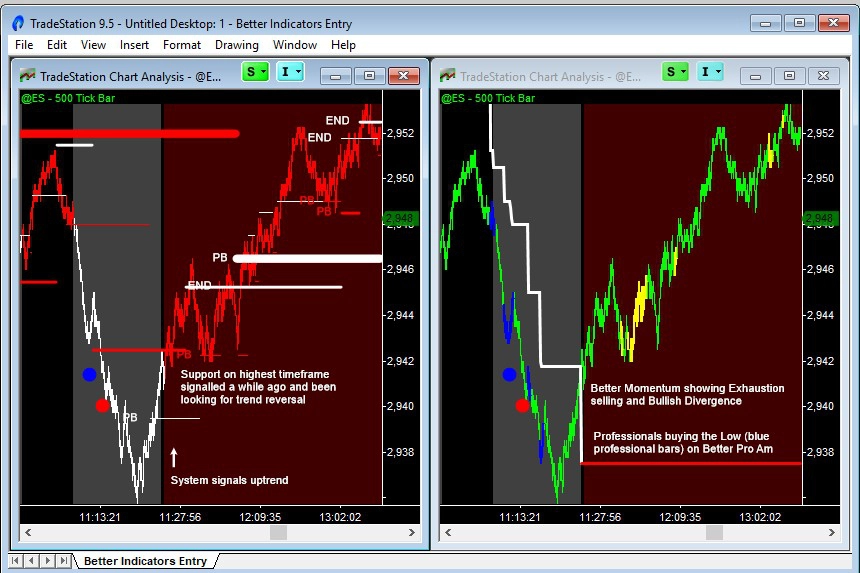
Markets turn with a repeatable pattern – this is true for all markets and in all timeframes. The pattern from a downtrend into an uptrend goes like this:
- Exhaustion selling volume (on Better Momentum)
- Professionals buying the Lows (on Better Pro Am)
- Less selling volume with Bullish divergence signal (on Better Momentum)
- First break above Resistance price level (on Better Sine Wave)
- Test back down into Lows with Amateur activity (on Better Pro Am)
- More breaks above Resistance price levels (on Better Sine Wave)
The pattern from an uptrend into a downtrend is just the inverse of the above sequence. And what the sequence shows is the combination of the 3 non-correlated Better Indicators working together to increase signal accuracy.
For example, if the market starts to turn from downtrend to uptrend but does not show Professionals have been buying the Low – then the reversal is not a true change in trend. And what is likely to happen is the market will rally back to higher price levels where the Professionals will Short again – and the downtrend will resume.
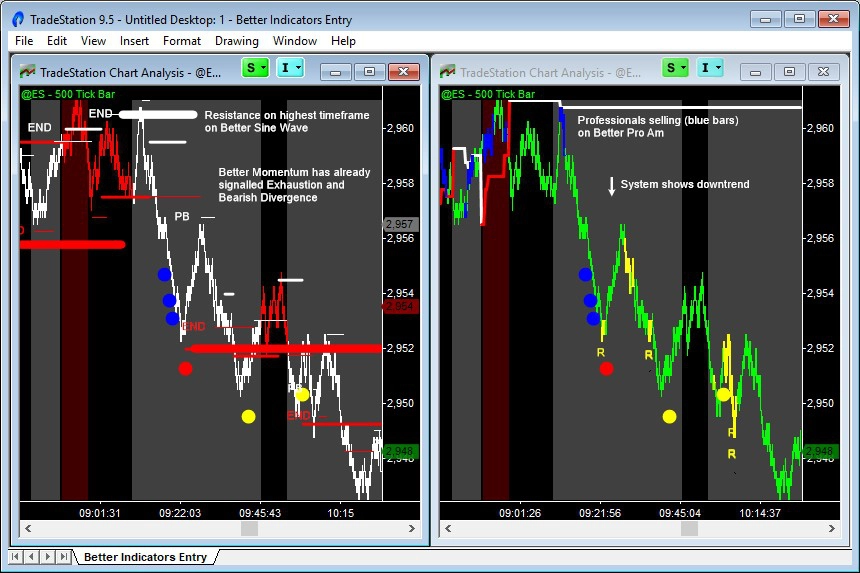
The chart at the beginning of this section shows the 3 Better Indicators signalling a Long trade. The chart background changes from grey to red indicating a confirmed uptrend. The chart just above shows the 3 Better Indicators signalling a Short trade. Again, the chart background changes from red to grey indicating a confirmed downtrend.
Should You Use Market or Limit Orders to Enter?
Conventional wisdom and best-selling trading books say plan your trade, get the best entry you can, don’t chase the market, etc. But in real life it’s not so easy to be calm when trading a fast moving market like the Emini.
A typical scenario goes like this:
- The Emini breaks out and you decide to go Long.
- You calmly place a buy Limit order 1 point below the breakout level because you don’t want to chase the market and want a “good” fill.
- The Emini continues to break higher and quickly now.
- You’re annoyed you didn’t get filled and so move your entry price up.
- You’re still not filled and the pullbacks are 0.5 points at most, you’re getting really stressed now and the market is 2-3 points above your original buy Limit order.
- In desperation that you’re going to miss the move entirely you switch your order from Limit to Market and get filled immediately.
- The Emini trades 0.5 points above your entry price then starts to drop and eventually drops 2-3 points from your entry, making you sick to your stomach.
The problem with Limit orders is: What do you do if you’re not filled? I’d rather not go through the stress – so as soon as I get a signal, I enter at Market. Sure, there are often better entries in the next few minutes, but I’m in and can calm my mind and ride the trade out.
Should You Scale In and Out of Your Positions?
Again, conventional wisdom says be cautious, no need to risk all your capital at once, scale into a position in two or three legs. Then scale out too, taking profits as a trade develops and try and maximize your winnings.
Now, maybe I do agree with that advice if you’re trading or investing long term.
This happened to me last year, trading a long term position in the Natural Gas market. I had entered early and the market had sat in congestion during the Summer. But then as Winter approached and the long range weather forecasts said it was going to be colder than usual, Natural Gas started to run up. I knew my trade was going to work out, so I doubled my position – and then exited 100% of the position as the market spiked.
But Emini day trading is a different game. Things move fast – sometimes trends last all day, sometimes they fizzle and you’re scrambling to get out at breakeven. Your biggest enemy day trading is you, your mental state, the stress you feel as you trade. And the only way I’ve found to reduce the stress is keep things simple and reduce the number of decisions you have to make:
- Trade one market
- Trade one timeframe
- Enter at market
- Enter 100% of your position at once
- Exit at a pre-defined profit target or stop loss
- Exit 100% of your position at once
And be happy with what you make – don’t try and maximize your profits every day. That leads to over-trading. And over-trading leads to stress, poor decision making and losses.
Where Should You Put Your Profit Target and Stop Loss?
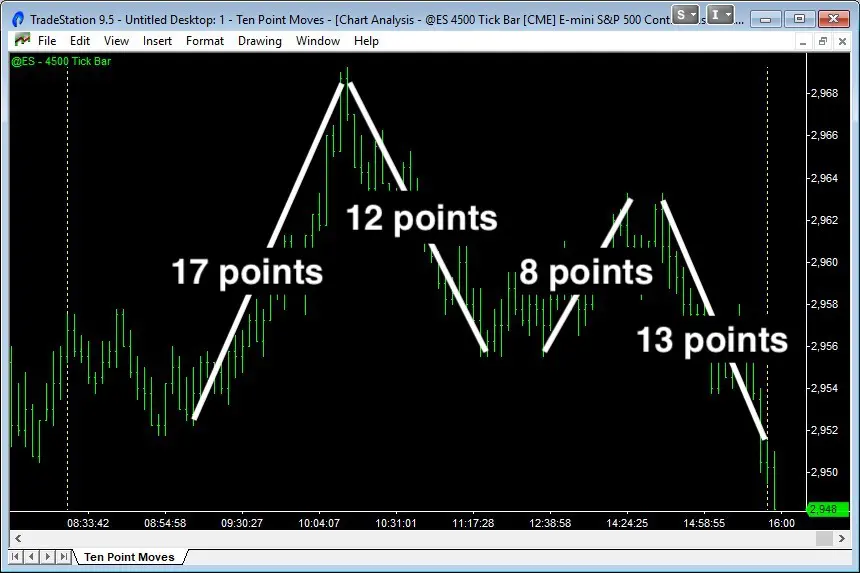
In general, the Emini trades with 8 to 12 point swings. Yes, some swings are bigger (the chart above shows a 17 point swing at the beginning of the day) but the normal swings are 8 to 12 points.
Now, don’t confuse swings with the daily range. Over the years the Emini has gone through periods of both extreme high and low daily ranges. For example, in 2018 we had a large number of days with 80+ point ranges. But during 2017, we barely had any days with more than 22 points of range. Although a day’s range can be large, it is usually made up of “swings” that are punctuated with significant counter moves.
And the swing is what you’re trying to capture in your day trading. You’re not trying to buy the day’s Low and sell at the day’s High. You want to get the trend direction right and then ride a swing in that direction and get out before there is a significant retracement.
Now, I’ll never catch the Low or the High of that swing – but I will be able to take a chunk out of the middle. That means my profit target is 4 points at a minimum and then if the Emini is moving quickly I can generally move my target out to 5 or 6 points. You can always tell when the market starts to “run” – this often happens when we break to new Highs or new Lows and stops are run.
And when that happens look for Exhaustion volume on Better Momentum. It’s often a perfect place to exit on an extreme.
As for stops, I definitely recommend wide stops when Emini day trading. That means my stop loss is 4 points and that seems to be about the sweet spot for me – but I’ll also jump out quicker if a trade is not going right. And 4 points seems to work well even when the market is super fast, like FOMC days, or during the wild sessions we saw in 2018.
And do I need to say this? Never, ever, cancel your stops.
How to Re-Enter in a Strong Trend?
The Emini moves fast – and sometimes you don’t have the conviction to enter one the first change of trend signal. When this happens, don’t chase the market. Wait for a pullback to get a better entry and reduce your risk.
Some re-entry signals are shown in the Emini trading charts above:
- Make sure Exhaustion volume hasn’t printed (so the trend is still intact)
- Confirmed trend temporarily switches off (black background)
- Wait for Better Sine Wave to signal Resistance level in a downtrend or Support level in an uptrend
- Enter on the Better Sine Wave signal or wait for confirmed trend to resume (grey or red background)
And then when you get Exhaustion volume, the trend is over and beginning to lose steam. And that’s when you should stop trading and patiently wait for the next trend setup.
How to Deal with the Psychological Stress of Trading?
First – don’t start day trading real money until you have “paper traded” or “simulator traded” for at least a year. I know, I know. That sounds really harsh. But the psychological stress of even “paper trading” is easily doubled when you’re trading with real money.
So avoid trading with real money for as long as possible.
Then while you’re “paper trading”, take small dollar, longer term positions in ETFs instead. That way you’ll feel as if you’re trading and not missing out on profitable trades. Meanwhile, work on your day trading system and getting used to the day-to-day psychological ups and downs.
Second – pick a small target to make each day (in my case, 4 Emini points) and then when you’ve made that, stop trading for the day.
Don’t get greedy – get out! Emini-Watch.com
There is nothing like the satisfaction of a “One Shot One Kill” (or “OSOK”) day. One deliberate trade, well executed, quickly taking profits and being done for the day.
Third – focus and take your trading damn seriously:
- Trade 1 market and be a specialist, not a generalist
- No distractions, focus 100% for the first 90 minutes of the trading day
- Know when the major news releases are, but don’t follow them
- Don’t be on Twitter, talking in a forum, listening to a trading room
- Don’t be at work (do I really need to say that?), and
- At the end of the day, review your trades and track them with a Trading Log
Once you’re profitable with real money, the next question is “When to go full-time?” But let’s leave that to another article and video.
How to Prepare for the Trading Day?
In the 15 minutes before the Emini open, at 8:30am Chicago time, I do two things:
- Check the timing of any important data releases, and
- Identify the most likely early trend direction
There are lots of online Economic Calendars where you can check the day’s data releases. My current favourite is the one on DailyFX. In the drop down menu settings, I just set the time to Chicago time zone (GMT-5 or 6) and un-tick the “Low” importance releases. That makes the table much easier to interpret and note the times of day I need to be ultra careful.
I’m not interested in what the number is or trying to anticipate whether it’s a good or a bad number. All I’m interested in is being out of the market when economic data is being released – so I can reduce my risk from the extra volatility and avoid being “accidentally” taken out on my stop.
The early trend direction is usually a continuation of momentum from the previous day or overnight activity. The general public don’t have time to follow the market during the day, so they place their orders for the next morning. If yesterday was up, then the general public will be chasing the market and their orders will push the market up first thing. The opposite is true if yesterday was down.
I’m looking at two indicators here. First, the recent Combo trend signals – is the chart background mostly grey and in a downtrend or dark red and in an uptrend. Second, I’m looking at Better Momentum and any Exhaustion volume signals. The highest probability trade just after the Open, is a continuation of trend until we see Exhaustion volume.
What Days or Times of Day Should You Avoid Trading?
The best time to day trade the Emini is between 8:30am and 11:30am, Chicago time. That is, from the Open until just before lunch time. During those first 3 hours of trade, you will have the largest number of participants active in the market because US and European trading overlaps.
There is usually an early morning trend move and then towards the close of European trade (11am, Chicago time) another trend move will set up. By lunch time all the news that was due to be released that day is out and the day’s direction has mostly been set. Yes, sure we get afternoon reversals and the occasional strong afternoon move. But for the most part, the largest trend moves will be in the morning.
So what about days or times of day to avoid trading? I would avoid trading:
- After the Emini market closes and up until the Asian markets open
- The morning of FOMC days (rate decision and release of Fed minutes days)
- First few minutes after FOMC announcements (1:00pm to 1:10pm, Chicago time)
- Half day (pre-holiday) trading days, and
- Trading days during “4 day weekends” (for example, Friday after Thanksgiving)
When to Exit a Trade Early or Stop Trading for the Day?
Overtrading is my biggest sin when it comes to day trading. Jumping in, then jumping out when things don’t “feel” right. And when the market moves in my original trade direction, jumping back in. I convince myself that the “round trip” commission is only small and so it costs me “nothing” to change my mind.
The longer you play, the more likely it is you will lose. Gambler’s axiom
But if, by the end of the day, I’ve made 5 or more trades (that is 5 entries and 5 exits) then it’s a near certainty that I’ve had a bad day’s trading and lost money. And even if, by some miracle, I’ve made money on that day it doesn’t feel good – it just feels like I got lucky, instead of traded well or deliberately.
There is a very fine line between exiting a poor trade early and exiting a trade that doesn’t “feel” right (and starting the downward spiral into overtrading). So I try and stick to these rules:
- Only exit a trade if my 4 point stop gets hit or the Combo trend reverses
- Stop trading for the day after making my 4 point target
- Stop trading after being stopped out 2 times
- Stop trading after 5 trades, and
- If the market is slow, stop trading and do something else
What Is the Best Charting Software?
Which charting software to use is a very personal decision and many factors will come into play when making your decision. But, for what it’s worth, I consider the best charting platforms are:
- TradeStation
- NinjaTrader
- Thinkorswim
- MultiCharts, and
- TradingView
Of those, I prefer TradeStation and have used it since 1999. It really is the leading charting platform. But I’m also very impressed with TradingView, a web-based charting platform built by the makers of MultiCharts.
TradingView shows the future of charting platforms: web-based and covering all instruments and exchanges in the world (including Cryptocurrencies). But it is not a “professional’s” charting platform yet. From what I can see, it has three drawbacks:
- No tick charts (although promised)
- New programming language to learn, and
- Not consistent between historic and real-time charts (i.e. chart looks different after refresh)
The factors that keep me with TradeStation (and sold me on the platform in the first place) are:
- Look and feel of charts and UI (don’t underestimate this)
- Easy to use programming language (EasyLanguage)
- Built-in (and reliable) data feed
- Active forum (to answer coding “how to’s”), and
- Large number of third party suppliers
What Is the Best Market Data Feed?
I don’t think anyone has done a comprehensive comparison of data feeds to find out which ones are quickest and most reliable. But, for what it’s worth, here are the data feeds I consider best:
- TradeStation
- Kinetick
- CQG/Continuum
- Rithmic, and
- eSignal
It is important to use a high quality data feed, particularly when day trading using tick charts. And make sure your data feed has both real-time and historic tick data.
Luckily, with TradeStation the data feed is “in-built”. All you have to do is subscribe to the data series you want access to. This adds to your monthly trading costs, but view it as just a cost of doing business.
What Is the Best Trading Computer Setup?
A great trading computer setup for mid-2019, has the following specs:
- 32 GB RAM
- 2.9 GHz Intel i9 (6-core) processor
- 500 GB SSD hard drive storage
- Windows 10 (64-bit)
- 15″ – 17″ laptop screen or two 24″ monitors on a stand, and
- Surge protection for laptops or uninterruptible power supply (UPS) for desktop
There are a couple of great companies that specialise in custom-built trading computers and screen arrays (EZ Trading Computers and TradingComputers.com). But you could also consider laptops and desktops that are built specifically for gaming since gaming requires similar high-performance data processing and screen quality to trading. Dave2D has a great YouTube channel where he reviews the latest gaming computers.
These days, the average computer (laptop or desktop) has become so powerful that it is no longer your limiting factor. A more important limiting factor to consider is a slow or “jittery” Internet connection. Remember, a poor-quality Internet connection will result in lost data packets – and this is a real problem for tick charts. These days I use this service and look for a minimum of:
- 12 Mbps download speed
- 100 ms ping (or latency), and
- 1 ms jitter
And don’t forget. Just because I listed Windows 10 in the ideal specs above doesn’t mean you can’t consider trading on an Apple Mac. I use a fully-spec’d 15″ Apple MacBook Pro laptop loaded with Parallels (emulation) software. This allows me to run TradeStation in Windows on my Mac. Genius really (and very stable).
Who Is the Best Futures Broker?
If you use the TradeStation or NinjaTrader charting platforms, your cheapest option is to use TradeStation or NinjaTrader as your broker. Their charting platforms come free if you use their brokerage service and transact a minimum number of monthly trades. And for most traders, this is perfectly adequate.
But if you’re happy with leasing or buying your charting platform, your broker options open up. Years ago, the broker field was wide open, and the brokers had big differences. The EliteTrader forum had a huge section where traders compared brokers and sounded off if they felt they had been mistreated.
The field has narrowed these days; a few big brokers dominate and their offerings are similar. Stockbrokers.com do a good job of comparing the leading futures brokers. But you can’t beat one of the largest Interactive Brokers for my money, and that’s who I use. Here are my reasons:
- Order fills are super fast and “slippage” rare
- One (universal) account for trading futures, ETFs, stocks and forex (other brokers require separate stocks and futures accounts)
- Ability to change the underlying base currency and so in effect have a currency overlay
- Split one order between different accounts (personal, pension, etc.)
- The account opening process is 100% online
- Strong financial backing (gave me confidence during GFC and MF Global debacle), and
- Low commissions
I don’t like their online account management platform, which is different from the order entry platform (TWS). I find it confusing, particularly if you have multiple accounts. Their statements are also a bit complex and I’ve gotten myself into trouble a couple of times when running currency overlays.
What Should Your Trading Backup Plan Look Like?

Your hardware is going to fail. Period. So you need an effective trading backup plan. As I see it, there are 3 disaster scenarios you need to plan for:
- Internet failure from ISP outage, power blackout, etc.
- Computer failure from hard disk crash, motherboard failure, etc.
- The time it takes to replace hardware, restore Internet service, etc.
The Internet failure is a minor inconvenience – as long as you can get out of any open positions. On the other hand, the computer failure can be serious. You can lose months of hard work and it can take weeks to restore your data and computer configuration.
What I hadn’t realised before October 2018 – and what prompted me to re-write my backup plan – is that the delay in replacing hardware could also potentially take weeks and be crippling.
So here is my updated 7-Step Trading Backup Plan:
- Use your trading platform’s auto-backup feature. This “no-brainer” suggestion takes 3 minutes to action and then you’re set up for good. So check out your platform’s tutorials and help guides.
- Use a cloud backup service, like Google Drive. Yes, this option costs a little bit of money. But the peace-of-mind is priceless. It’s a modern solution to a modern problem.
- Use a broker with “server side” order handling. Possibly the most important suggestion in the trading backup plan. So go check out your broker’s discussion forums or call their tech team.
- Use a cell phone that can act as a mobile hotspot. This is an easy way to have a backup Internet connection. Just make sure your mobile carrier is not the same as your home Internet service provider.
- Keep your broker’s telephone number handy. You’ll be stuck if your Internet goes down and you can’t do a Google search for your broker’s contact details. Write them down on a post-it note and stick them to your computer.
- Have a backup computer, like a Chromebook, ready to go. The beauty of a Chromebook is it’s very easy to sync with your main trading computer. But you’ll also need to have access to TradeStation on a virtual machine in the cloud.
- Use a laptop or power your computer with a UPS. Then if you have a mains electricity outage, your uninterruptible power supply (UPS) will kick in or your laptop’s battery will stop your charts from crashing.
And stop procrastinating about this – you need a trading backup plan. Just do it!
12 Point Summary
Well done, if you made it through the over 8,000 words in this article. If not, here’s a quick summary with links to some of the best content on Emini-Watch:
- Trade one market and become a specialist in that market. Emini (ES) or Micro Emini (MES) futures are perfect but there are other markets if you can’t trade the US time zone.
- Focus on the first hour of trade and stop trading after making a small profit (4 Emini points). Over-trading will kill your profits.
- Keep your charts simple and stop using multiple price-based indicators. You will get better signals by using just 3 non-correlated indicators that analyze: price, volume and average trade size.
- Price movement alternates between cyclical and trending phases. Better Sine Wave measures both price cycles and trends and is much better than a moving average.
- Volume is the fuel that drives price. Better Momentum measures the waves of demand and supply volume and is superior to a price-based momentum indicator.
- Professionals trade in size; Amateurs trade in singles. Better Pro Am measures average trade size and allows you to follow the Professionals and fade the Amateurs.
- The ‘Better’ indicators work on all timeframes and markets – even Forex, Crude and ETFs. But they work best on tick charts and with multiple time frames.
- Markets turn with a repeatable pattern. Pick one entry signal and stick with it: my entry signal is a breakout into trend, which I use with my day trading Rules of Thumb.
- Tight stops and trailing stops don’t work in volatile markets. Use wide stops and profit targets instead (4 Emini points, 1:1 risk-to-return). And don’t be afraid to exit with a small loss.
- The fastest way to become profitable is to stop repeating your most common mistakes. Track your trades with a trading log and focus on eliminating errors.
- Invest in your technology. Use the best charting software, best trading computer setup (like TradeStation on a Mac) and best Internet connection. And always have a trading backup plan.
- Day trading is the hardest thing you’ll ever try to do and most people fail. So toughen up, trust your indicators and focus on becoming an unemotional, consistently profitable trader.
Hope you enjoyed this article and good luck with your Emini trading.