Been mulling over my longer term investment strategy for a while now. Emini day trading, real estate and cash will only get me so far. It’s time to broaden the horizon. And with the S&P 500 at record highs, are there better opportunities around the world?
Here’s an ETF Trading Strategy that identifies the most beaten down stock markets around the world and uses the ‘Better’ indicators to time entry into the start of an uptrend.
Step 1: Search for high dividend yielding stock market ETFs
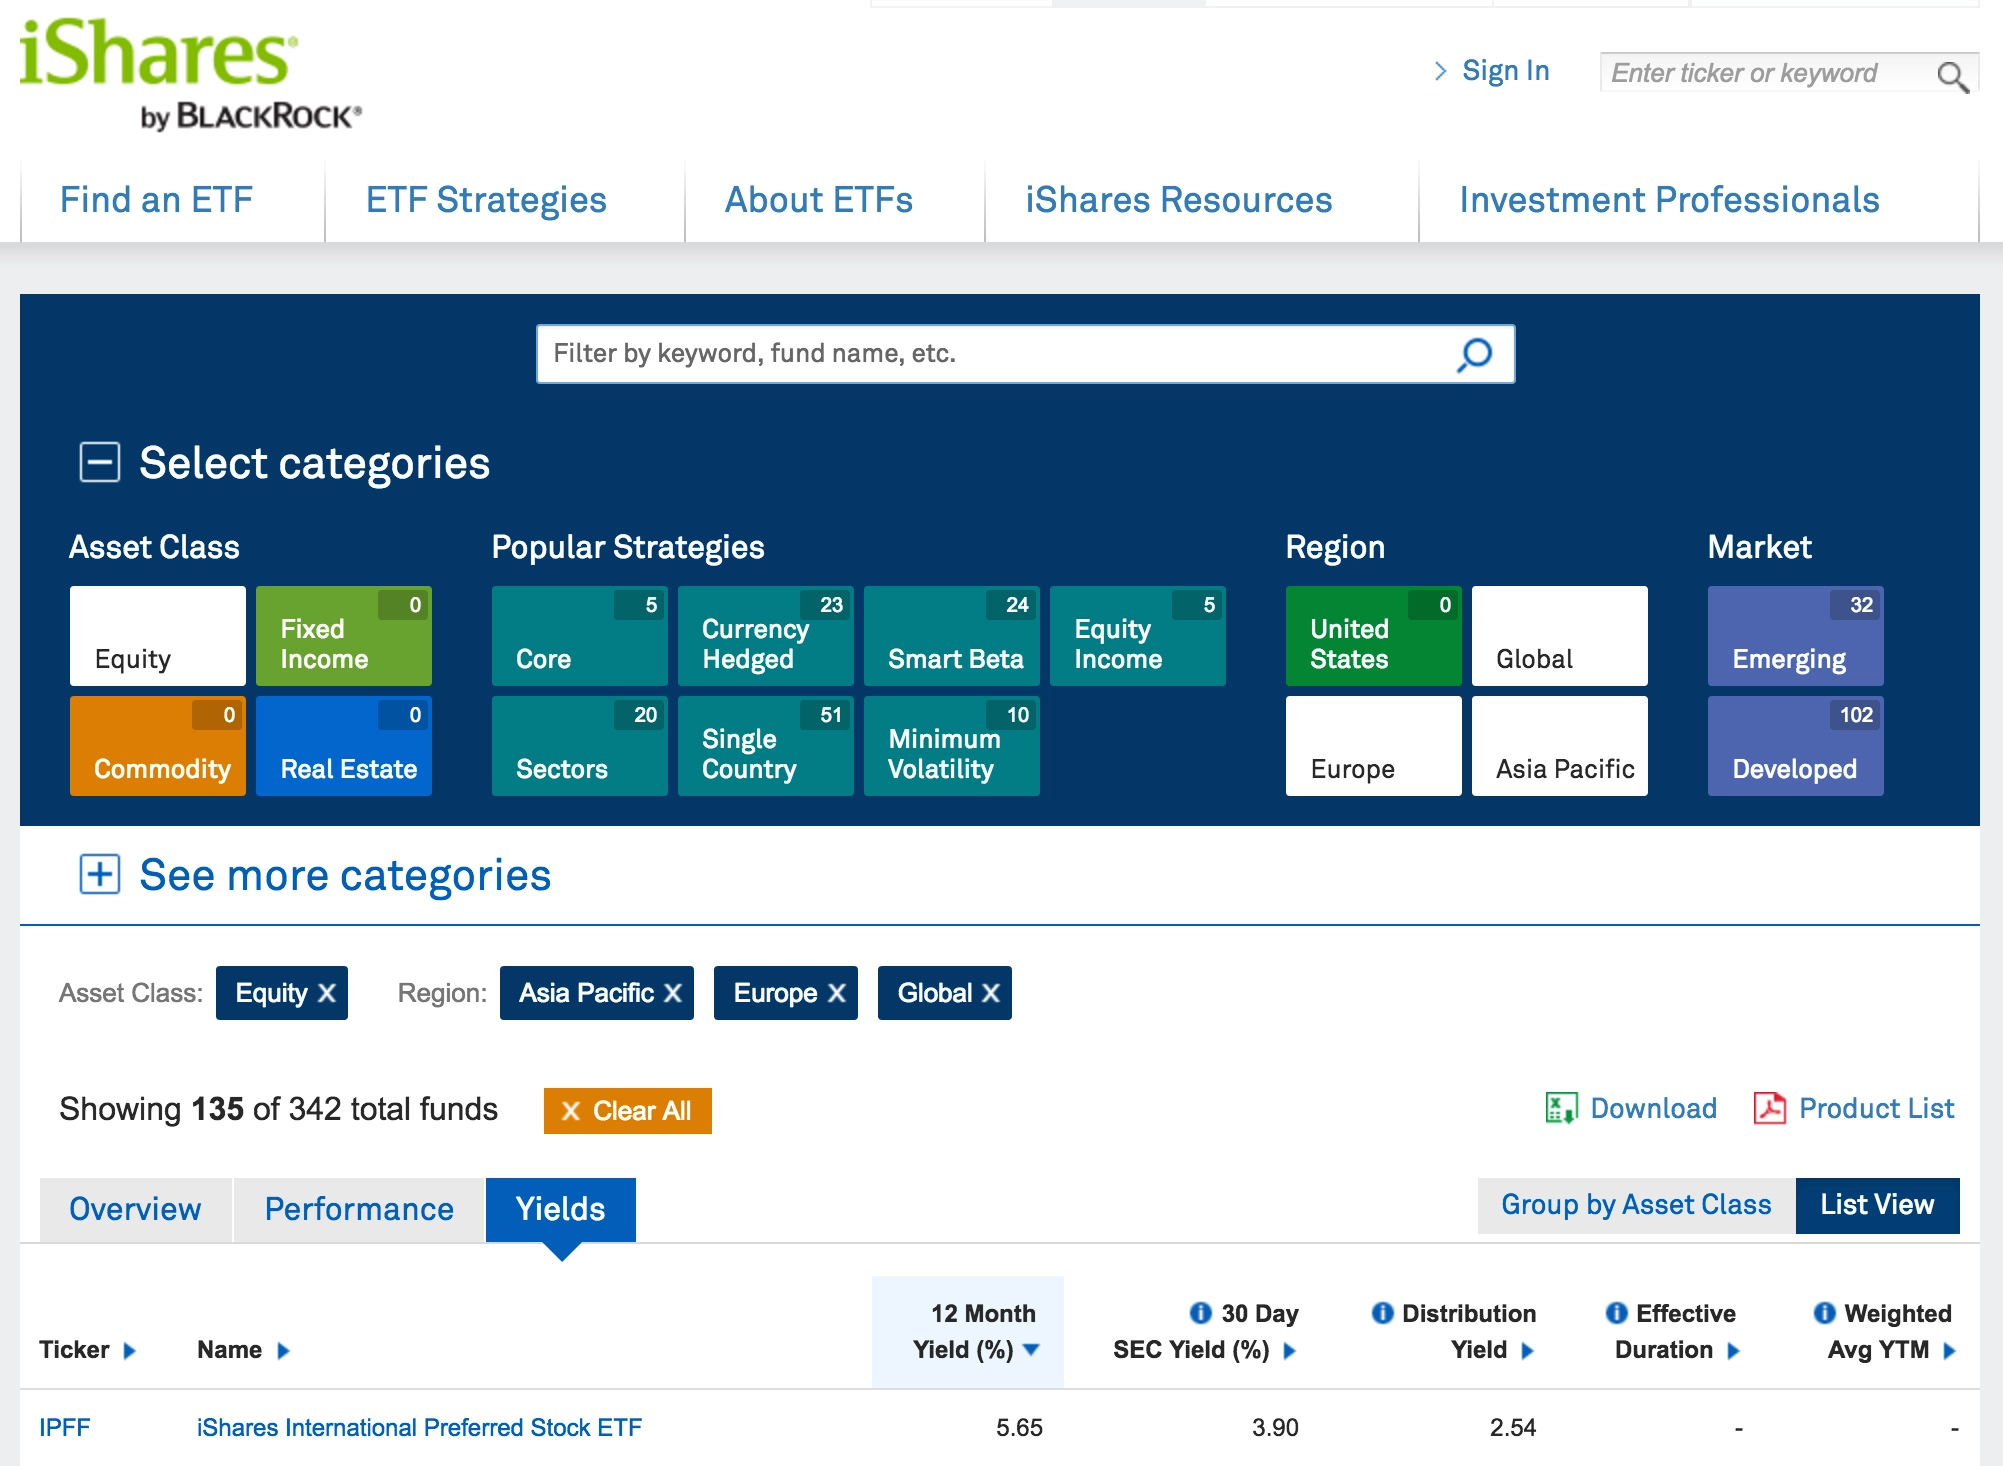
BlackRock, with their iShares brand, is the largest issuer of ETFs. They have almost US$1 trillion in Assets Under Management! They cover almost all global stock markets – the only countries they seem to be missing are Mongolia, Egypt, Argentina and Greece.
They’ve got a very handy website app to screen all the ETFs. You can narrow down to non-US stock markets and then list by dividend yield, in descending order. The higher the yield, the more the stock market has been beaten down.
So I start at the top of the list and work my way down.
Back in December 2015 this ETF screening process showed the Russian (ERUS) stock market was over-sold – and I think the dividend yield was up at 7.5%. The screen now, in August 2016, is showing the UK (EWU), Malaysia (EWM) and Spain (EWP) have been sold off. And, interestingly for me, a few months ago the Australian market (EWA) was towards the top of the list.
Step 2: Check you’ve identified the largest volume ETF
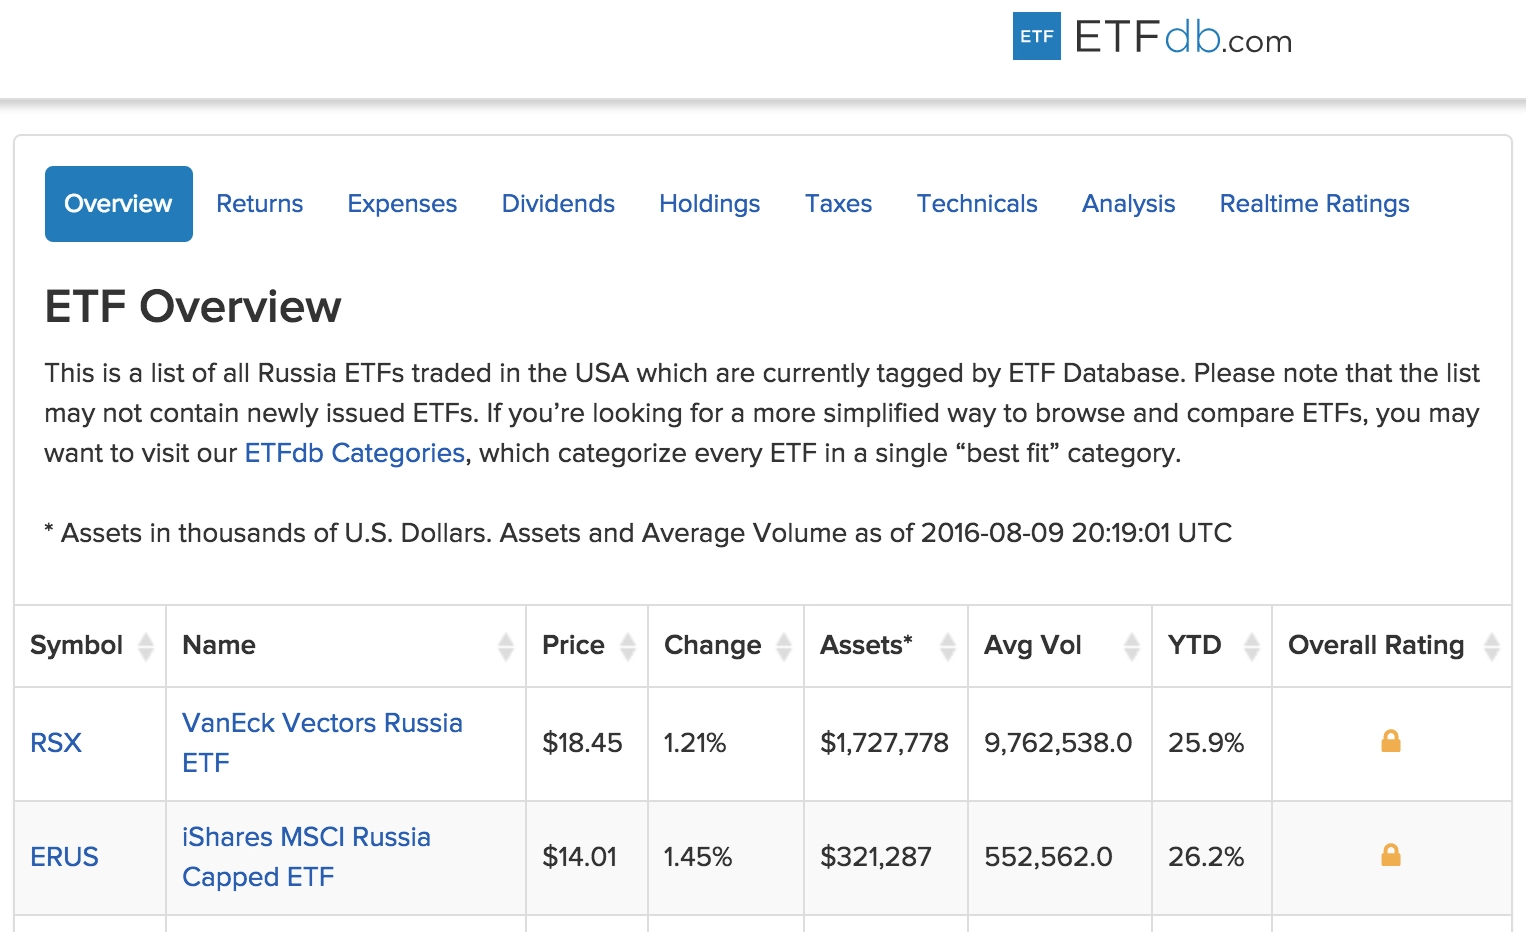
Although BlackRock is the largest issuer of ETFs, sometimes they don’t have the “leading” ETF covering a particular market. To check this I use the search function in ETFdb.com. Just type in the country name and it will show you a listing of the top ETFs for that country.
In the case of Russia, BlackRock’s ETF, ERUS, wasn’t the largest. The top spot was taken by VanEck’s ETF, RSX – which was 5 times larger! You always want to be trading the most liquid symbol. Your fills will be better and the chart signals will be cleaner.
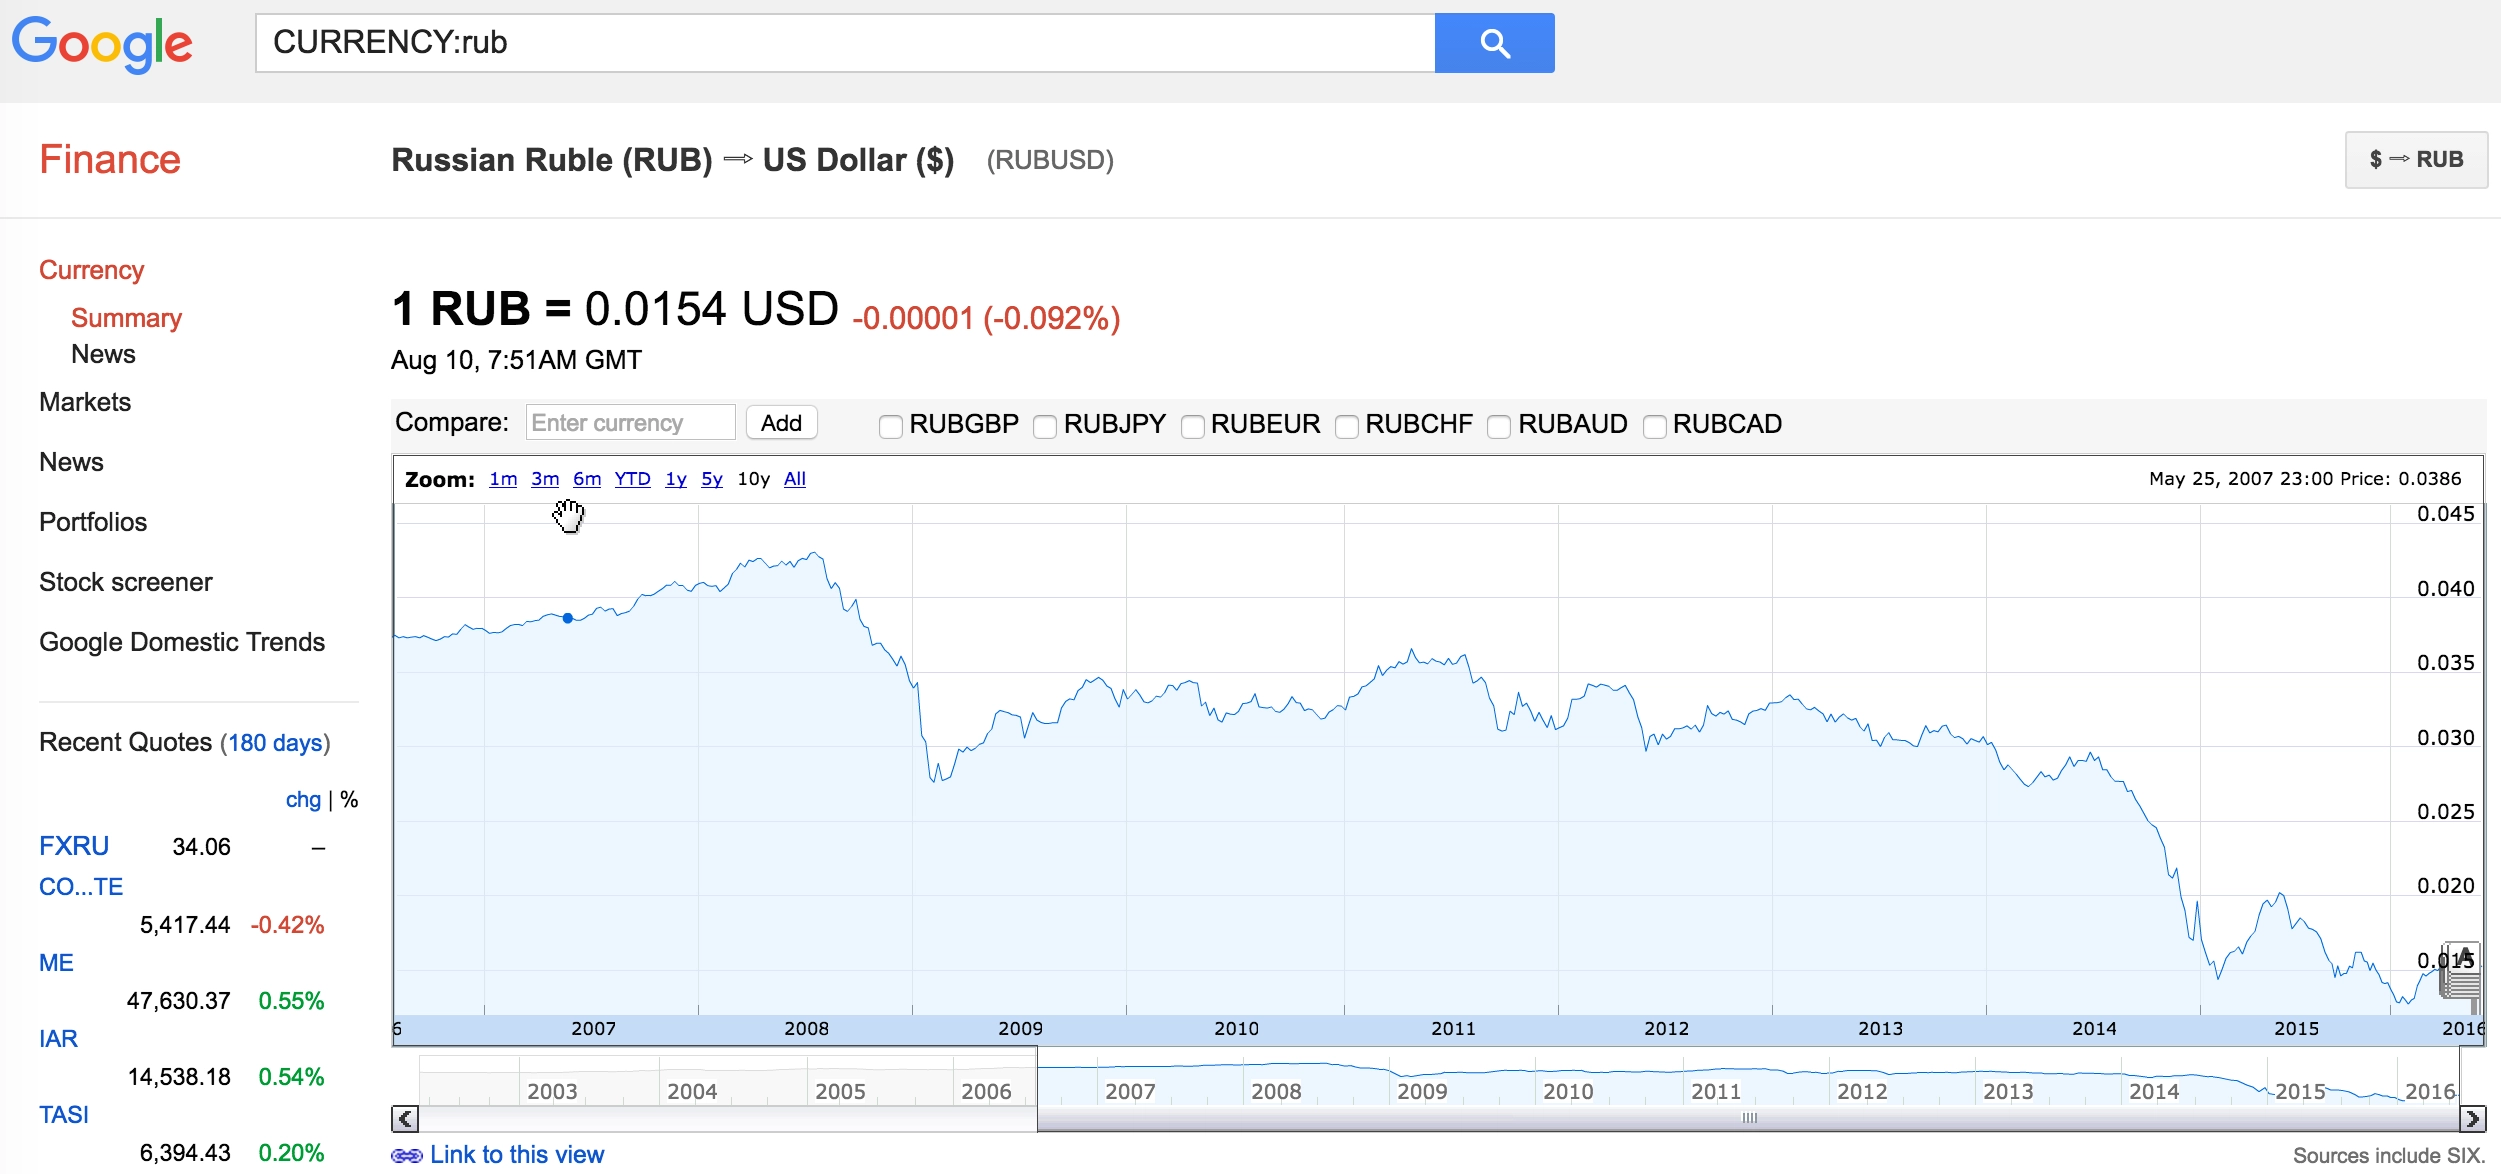
Step 3: Check the currency has started to appreciate
The aim of this ETF trading strategy is to benefit from 3 components:
- Country’s stock market appreciates
- Country’s currency appreciates (versus US Dollar)
- ETF distributions (dividends) while holding
Ideally, you want the stock market and currency to both go your way. If the currency symbol isn’t available within the TradeStation platform (and the Russian Ruble isn’t) then I check Google Finance.
Step 4: Watch the ETF chart until you get a Long entry signal
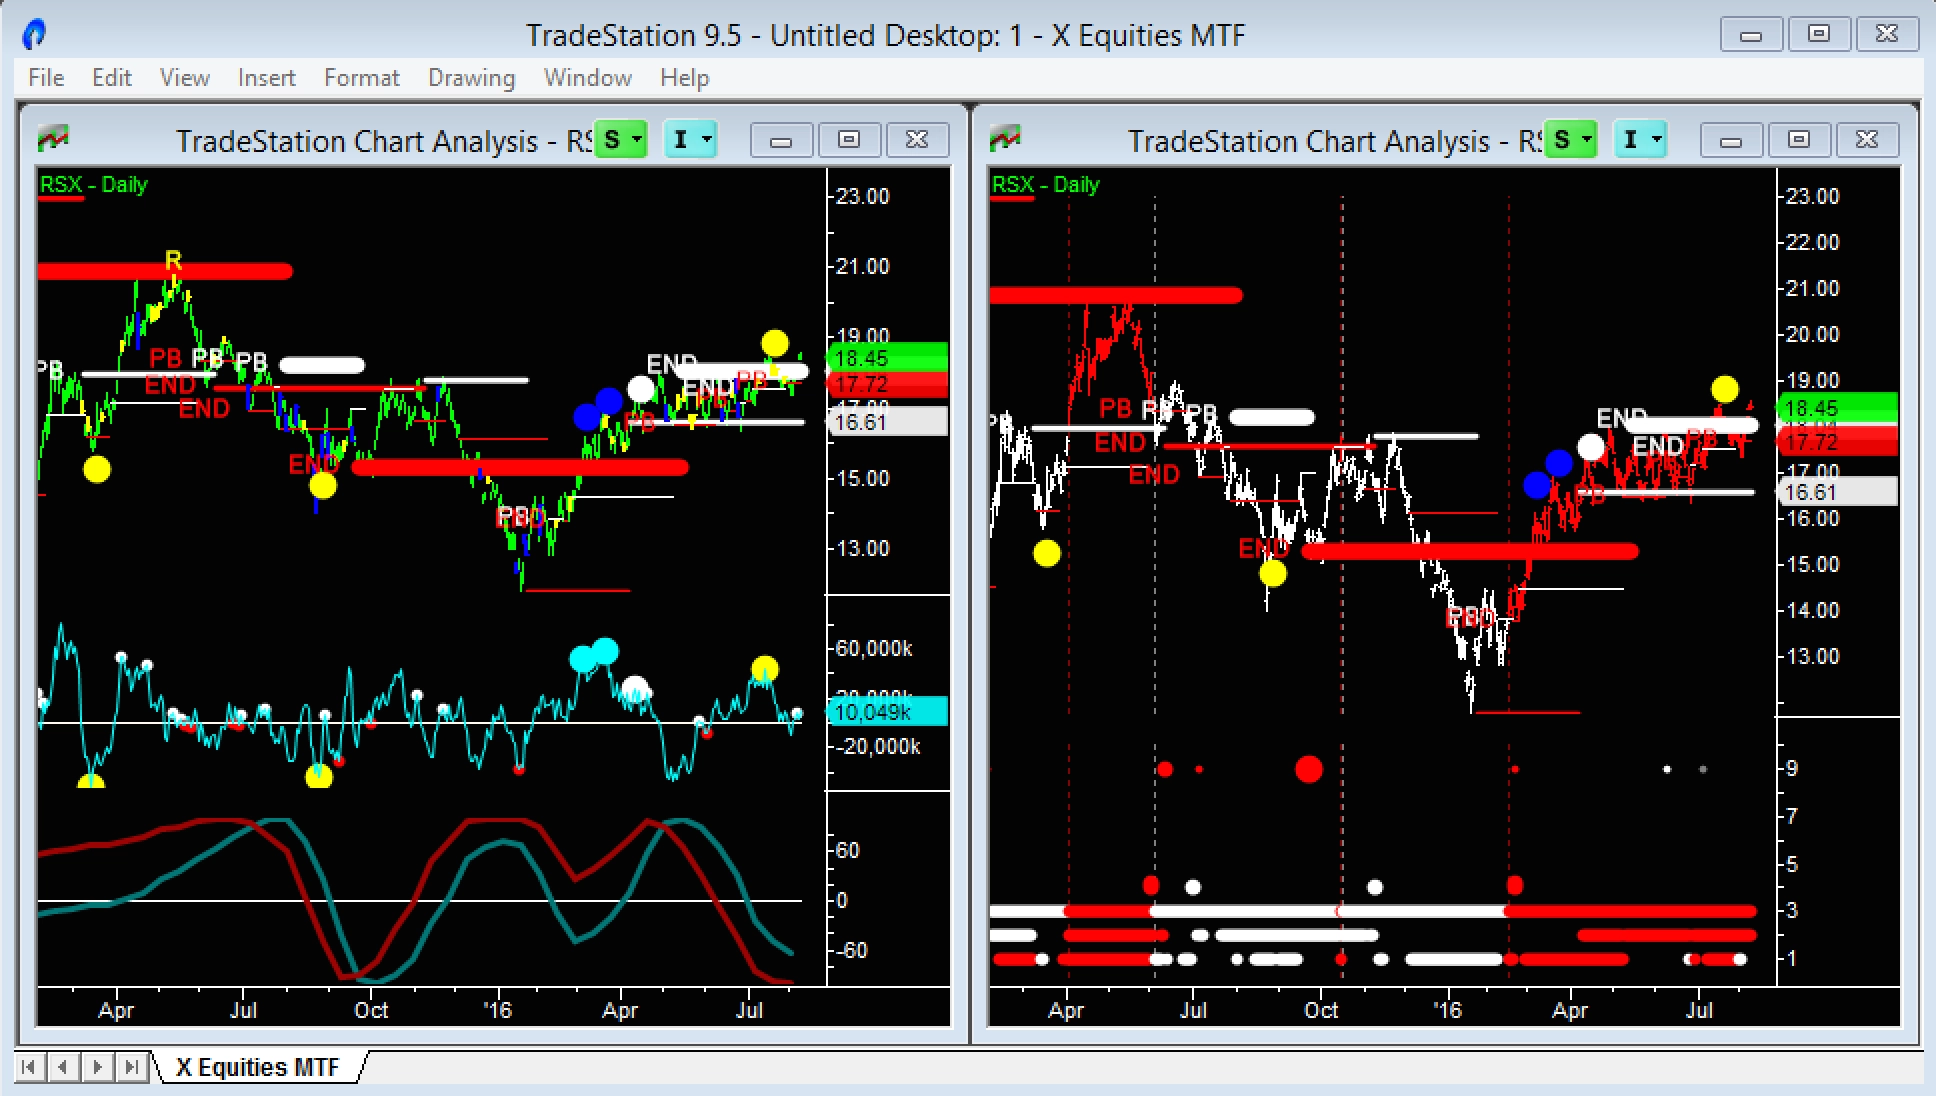
Lastly, time to add the ETF to your watch list. I’ve been watching the Russian ETF, RSX, since January 2016. Just waiting for everything to come together. The Russian stock market is heavily weighted toward oil and gas – so I’ve been watching the Crude chart (@CL) closely too.
In the last 2 months RSX has traded in a tight channel between $16 and $18 and the ‘Better’ indicator trading system has signalled Long (and stayed Long). At the beginning of this week I pulled the trigger and put half my position on. There still might be a final push down, particularly if Crude weakens any more, so I’m prepared for that.
Good luck with your trading and investing.