Quick video today about trends and cycles using the Better Sine Wave indicator. I go through one of my favorite setups: End of Trend signals in the lower time frame chart synching up with Cyclical signals in the higher time frame chart. Remember:
Trends in lower time frames are equivalent to cycles in higher time frames. Emini-Watch.com
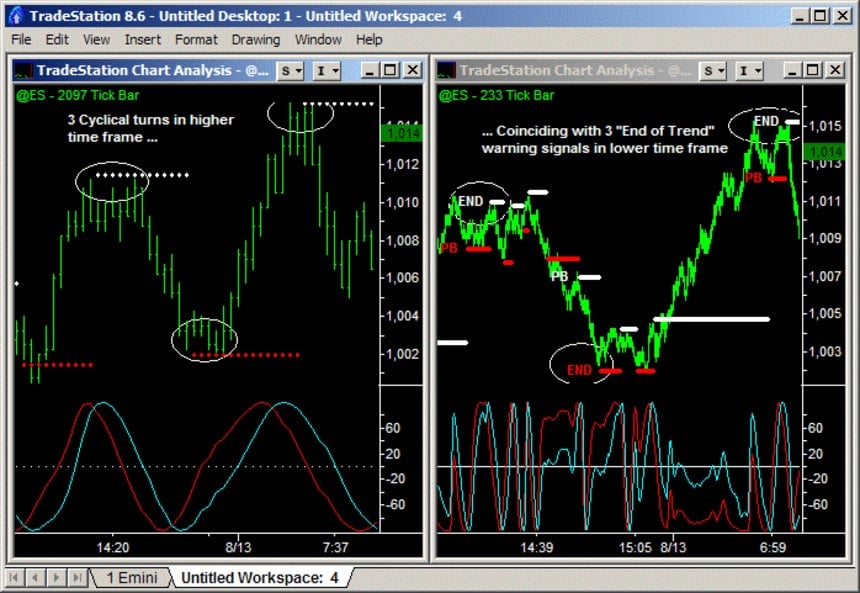
In the end we got 3 trend and cycle setups in a row. Each was good for a 10 point move in the Emini. Here’s the chart with the two timeframes and signals annotated.