The TRIN Index (or Trading Index or Arms Index) is a measure of stock market strength, originally developed by Richard Arms in 1967.
It is one of the few truly leading (as opposed to lagging) stock market indicators and is widely followed by market analysts. TRIN Index data is available for both the NYSE and NASDAQ markets.
In 1967, the idea of comparing the relative strength of stocks that were rising with stocks that were falling was revolutionary. Richard Arms had created a way of measuring stock market “internals” that showed the breadth in participation of stock market bullishness or bearishness. An up move in a stock market index without wide support was suspect and likely to be followed by weakness, and vice versa.
But there are problems with the TRIN Index
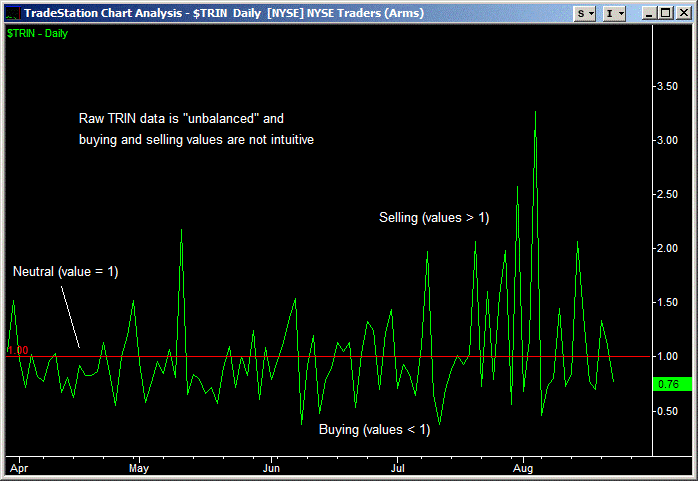
A chart of the raw NYSE TRIN data is shown above. As revolutionary as the TRIN Index was, there were some (serious) problems with it:
- The TRIN is not an intuitive value: Values above 1 indicate selling, values below 1 indicate buying. The reverse would be more intuitive – buying would be greater than 1 and selling would be less than 1.
- TRIN values are unbalanced: If stocks are bought and sold at equal rates, the TRIN Index value is 1. But after a day of heavy selling, the TRIN could be as high as 3. Similarly, the TRIN could dip to 0.3 after a day of heavy buying. When charted over time, the result is a graph with high spikes but shallow dips (see the chart above).
- Averaging the TRIN doesn’t work: Traditionally traders have averaged the TRIN data over 10 days. Any value under 0.8 represents an overbought market, while a value of over 1.2 indicates the market is oversold. But because the data is lopsided to begin with, this average is a faulty calculation at best.
How to make a Better TRIN Indicator in 4 simple steps
By making some simple mathematical adjustments to the original TRIN Indicator formula you can make a more intuitive and accurate indicator. Here’s what to do to create a Better TRIN Indicator:
- Take the Log of the NYSE TRIN value
- Invert this value so negative values are positive and vice versa
- Multiply the inverted Log value by 100, and
- Repeat for the NASDAQ TRIN data and average the two values
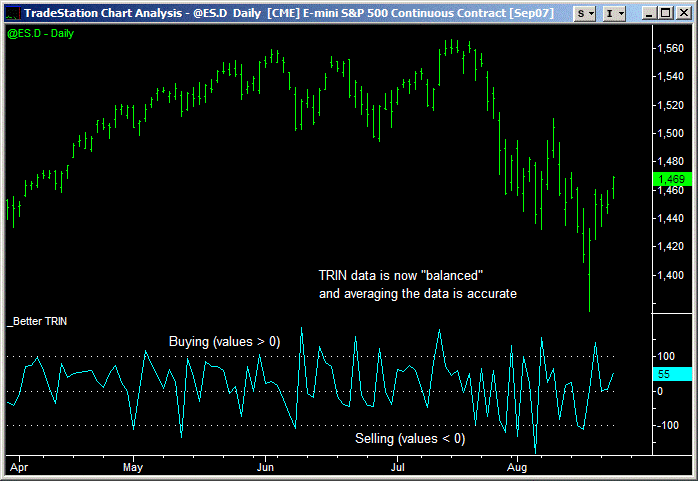
The chart above shows what the adjusted or Better TRIN Indicator looks like. If you have successfully followed the steps above, the Better TRIN Indicator is easy to interpret at a glance and gives you a better idea of market trends when averaged:
- Values range between -100 and +100, with 0 as the neutral point
- Positive values indicate buying and a market in an upswing
- Negative results indicate selling activity and downward moves in the market
- Values are balanced, requiring the same amount of buying or selling for the indicator to be +100 or -100 and, therefore, averages are accurate
Now, the TRIN makes more sense to me!
How to trade with the Better TRIN Indicator
Better TRIN is one of the best indicators I’ve ever seen. Thomas K.
I use Better TRIN all the time and I love it. Ara V.
The Better TRIN system – outstanding, excellent. Gordon R.
The TRIN Indicator video above goes through 5 different ways to use the TRIN Index to pin-point market turning points and improve your trading. Here are some screen grabs with commentary.
1. TRIN Indicator divergence patterns
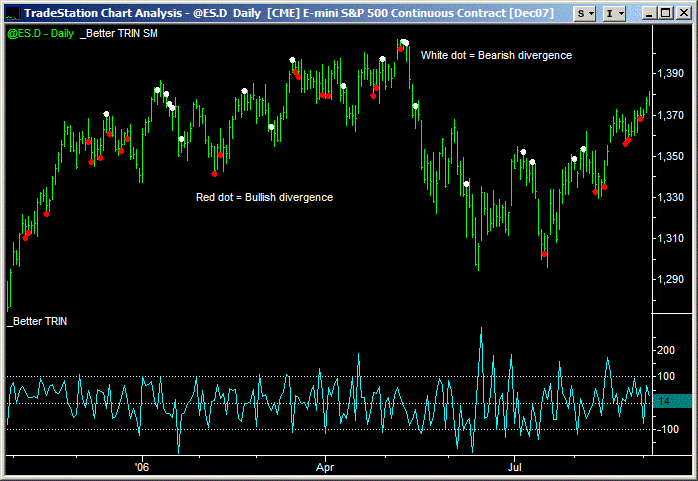
Divergence patterns on the TRIN Indicator occur when the market advances but the adjusted TRIN value is negative or vice versa. Since the TRIN Indicator re-sets at the beginning of each day, a market advance is assumed to be when the Close is greater than the Open.
These TRIN Indicator divergence patterns are shown on the chart above as red and white dots on Emini daily bars. Looking back on the chart you can see how well this single indicator warns of potential market turning points. I don’t suggest you use this indicator alone but combine it with other non-correlated market indicators to confirm turning points more accurately.
2. Turning the TRIN Indicator into an oscillator
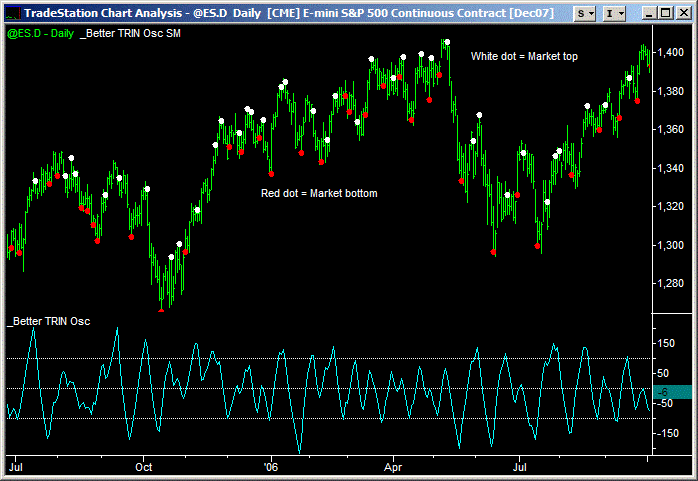
You can build a very useful oscillator by cumulating the adjusted TRIN readings and then measuring the distance from a moving average. I then use some simple mathematics to sharpen up the turning points and make the indicator crystal clear to interpret. The result is the Better TRIN Oscillator shown in the chart above, plotted beneath daily Emini bars.
Turns in the Better TRIN Oscillator are shown on the chart as red and white dots on the price bars. Looking back on the chart you can see how well this indicator alone confirms market turning points and measures market momentum. And remember, in the TRIN calculation there is no measurement of price, only the number of advancing/declining issues and advancing/declining volume.
Rather stick with your familiar RSI indicator?
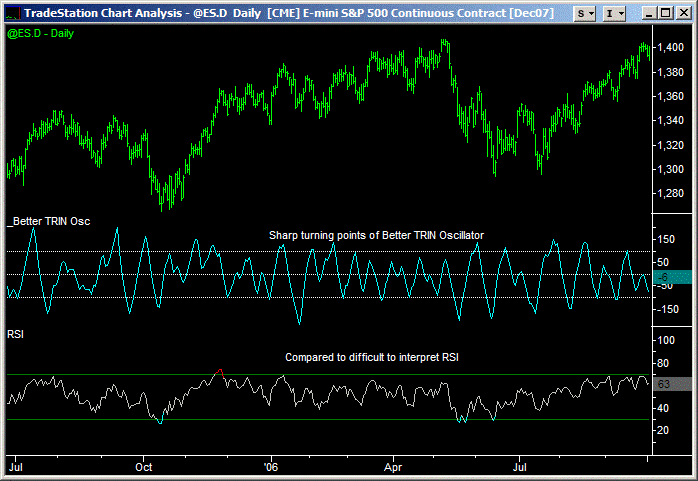
To see how clear the signals are using the Better TRIN Oscillator, compare it to the commonly used RSI. Daily Emini bars are shown at the top of the chart above, then the Better TRIN Oscillator and at the bottom of the chart is the built-in TradeStation RSI.
There’s no comparing the sharpness of the Better TRIN Oscillator signals. I know which indicator I’d rather be using!
3. Divergence patterns on the TRIN Oscillator are very powerful
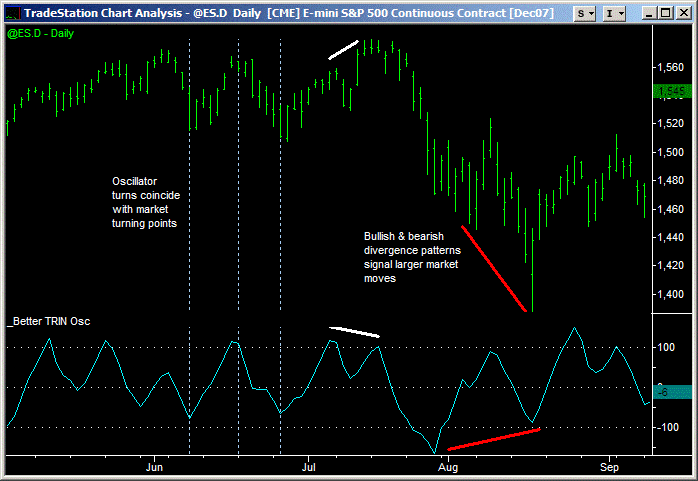
An even more powerful way of using the Better TRIN Oscillator is to follow divergence patterns against price. For example, a Bullish divergence pattern is made when the Oscillator makes higher Lows but price is making lower Lows. In the chart above two examples are shown.
In mid-July 2007 the market was still advancing but the Better TRIN Oscillator had made a lower High – an early warning signal of a 160 point drop in the Emini. Then in mid-August the Oscillator made higher Lows while the market was still dropping – again, an early warning signal of an important market turning point.
4. The TRIN Oscillator also works on intra-day charts
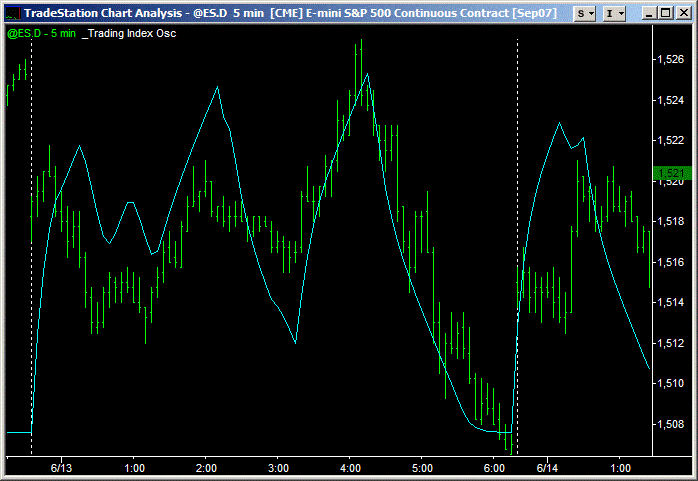
If you’re a day trader you can also use the Better TRIN Oscillator on intra-day charts. Any minute or hourly bar interval can be used, but unfortunately a TradeStation restriction prevents tick charts from being used.
The chart above shows the Better TRIN Oscillator superimposed on 5 minute Emini bars. The sharp tuns in the oscillator make it easy to interpret.
But remember, you should always be trading with the trend. And the best signals will be turns in the Better TRIN Oscillator that are in the direction of the intra-day trend.
5. Trading systematically with the TRIN Indicator
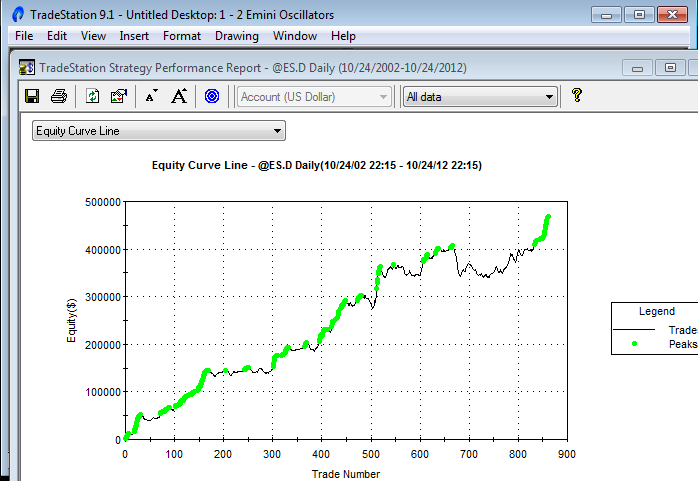
The Better TRIN Oscillator can also be used for building your own trading systems. Some example Better TRIN Systems are included in the Better TRIN Indicator Package, available below.
These Better TRIN Systems are very robust, have never been optimized since their release in May 2007 and continue to make new equity highs.
Better TRIN Indicator FAQs
What’s the difference between Better TRIN Indicator and Better TRIN Oscillator?
The Better TRIN Indicator measures buying and selling pressure at a particular point in time. For example, a daily reading of +50 indicates moderate buying during that day. The Better TRIN Oscillator shows the waves or cycles of buying and selling. For example, if the oscillator turns up from -100 and starts rising, this indicates the market has bottomed and traders are starting to buy.
Do the indicators and systems work with NQ, YM, TF, EMD, SPY and OEX options?
Yes and No. The indicators and systems also work for the mini-NASDAQ (NQ), mini-Russell (TF) and mini-S&P Midcap 400 (EMD). Instead of inserting ES in a chart, substitute the NQ, TF or EMD. However, because of TradeStation software restrictions you cannot plot TRIN data with the mini-Dow (YM), SPY or OEX options. But the Better TRIN system signals can still be taken on any index market – just trade the YM, SPY or OEX options instead of the Emini.
Do the TRIN indicators work for day trading, i.e. on intra-day charts?
Yes. The indicators have been updated to work on intra-day charts. The only exception is the TRIN divergence warning signal does not apply to intra-day charts.
Do the TRIN systems work for day trading, i.e. with intra-day signals?
No. The Better TRIN systems are not designed for day trading, only swing trading. If you want to use the Better TRIN Oscillator for day trading, look for divergence patterns between the oscillator and price for good entry points.
What system settings do you use for the Better TRIN example systems?
“Format Strategy” settings are: TypeA to TypeE = True; DoubleUp = True; Using both NYSE & NASDAQ TRIN data; Look inside bar back-testing disabled.
“Properties for All Strategies” settings are: Allow up to 50 entry orders in same direction regardless of entry; Trade Size = 1 contract; Commissions & Slippage = 0; MaxBarsBarck = 50; Max Contracts per Position = 65,000.
“Format Symbol” settings are: @ES.D symbol; Daily data; Data from 1998 but NASDAQ TRIN data not available that far back and so signals only generated from December 2001.
What is the logic behind the “Double Up” input in the example TRIN systems?
The “Double Up” input allows the systems to double the number of contracts traded on the next trade after a losing trade. This is a useful trick in improving system performance, however, from a statistician’s perspective it is not logical. They would argue that all trades are independent and that the probability of a winning trade after a losing trade is no different than after a winning trade.
However, from a practical perspective, if you have a robust system that does not have long losing streaks and you are sufficiently capitalized then the “Double Up” input will improve system performance.
Does the indicator use NYSE or NASDAQ TRIN data?
Both. In TradeStation subscribe to both NASDAQ Level 1 and NYSE data. Each real-time data feed only costs $1 per month. These settings can be found by logging into your TradeStation internet account and going to TradeStation Platform > Add/Remove Data or Features. TradeStation takes anywhere from a few minutes to a few hours to update new data settings and you will need to restart TradeStation for the requests to take effect.
Do the Better TRIN indicators use TradeStation’s new TRIN data symbols?
No. The Better TRIN indicators just use the NYSE and NASDAQ TRIN data symbols ($TRIN and $TRINQ). The new TRIN data symbols cover the Dow ($TRINI), S&P500 ($TRINSP), Russell 2000 ($TRINRL) and all US indices ($TRINUS). They are a good idea but do not have sufficient back data to be useful yet.
Do the TRIN indicators work on tick charts or share charts?
No. TradeStation does not allow multiple data streams to be plotted on the same tick chart or share chart.
What people are saying about the Better TRIN Indicators
Amazed by the accuracy
I am amazed by the accuracy of the Better TRIN and Better Put Call Ratio Oscillators.
George F.
Thank you!!!!!!!!!!!!!!!!
I’m really enjoying the Better TRIN indicator and it has already helped me several times in a few swing trades. Thank you!!!!!!!!!!!!!!!!
Brad M.
I have yet to see Barry Taylor put out something that isn’t superior
I have yet to see Barry Taylor put out something that isn’t superior. His Better TRIN swing-trading system makes steady money, is far better than many highly expensive systems and costs about $50.
CCLSYS, moderator Big Mike Trading Forum
Best indicators I’ve looked at
Not only has the Better TRIN been one of the best indicators I’ve looked at, but for only $70 with a nice follow up email, it seems too good to be true! I’ve found it extremely useful when applied to some of my trend following systems, its addition increased my profit factor and avg $ per trade substantially! So, a personal thanks for building it.
Brent McC.
Indispensable for my Emini trading
Firstly, let me tell you that your indicators have helped me turn my mediocre index futures trading results to consistently profitable levels. I find the Better TRIN Oscillator indispensable for my Emini trading.
Kishen C.
Profit factors of the Better TRIN systems are quite amazing
Having written many complicated strategies of my own, I have to say, the profit factors of the Better TRIN systems are quite amazing, considering the strategy is basically using just one indicator for it’s decision making.
George C.
Pretty awesome
I have added stops and targets and limit my number of contracts to two, even so the equity curve is still pretty awesome. I laughed today when I heard your description of the TRIN system – ‘just such a machine!’ Couldn’t agree more, this is a great addition to discretionary trading.
Steve M.
Can’t thank you enough for the Better TRIN
I simply can’t thank you enough for the Better TRIN, which should be called ‘The Taylor Oscillator’. It is wonderful and it is transforming my trading. There aren’t enough good things that I can tell you about the Taylor Oscillator. I am making money consistently for the first time. I can’t say ‘thank you Barry’ enough.
Robert A.