Commitment of Traders (COT) data is not the holy grail – but can be immensely useful in longer term analysis. Here’s how.
I tested all the different combinations and found that your method of futures only, all large contracts and net % had the best profit factor. I was really impressed because this tested better than Steve Briese’s method and he is known as ‘the’ COT expert. Your COT Oscillator is so simple, it’s ingenious! Michael M.
If you’re new to the Commitment of Traders data this article will explain exactly what it is, why you should track it weekly and how to incorporate it in your market analysis and trading. Then at the bottom of this article there is a link to download some free Commitment of Traders indicators.
What is the Commitment of Traders report?
The Commitment of Traders report breaks down Open Interest for all traded futures contracts into Long and Short positions by type of player. The people to follow most closely are the large, professional traders or “Commercials”. They are considered the “smart money” and can give you valuable clues as to future market direction.
The Commitment of Traders data is collected weekly after the close on Tuesday and the Commitment of Traders report is published after the close on Friday. You can find the weekly reports on the CFTC (Commodity Futures Trading Commission) website in text and spreadsheet formats. I use the ‘Compressed – Futures Only Report’ in Excel format. Once you’ve downloaded and unzipped the Excel spreadsheet, the raw Commitment of Traders data looks like the screenshot above.
Commitment of Traders data is now built into TradeStation
The Commitment of Traders data is now available within TradeStation. The code to access the data is quite simple and uses the “GetFundData” function. The code sample above calls the Commercials Long, Commercials Short and Total Open Interest data. Then it calculates the Commercials net position as a percentage of total Open Interest.
This is a huge improvement on the old-fashioned method of accessing Commitment of Traders data with TradeStation. It required importing the data via an Excel spreadsheet and then using a look-up data function in indicators – a real hassle.
But it’s not all plain sailing. TradeStation Commitment of Traders data is almost 24 hours delayed and lately I’ve encountered some data glitches. Still, better than the Excel spreadsheet method.
Commercials (or Professionals) hedge most of the time
The monthly chart of Sugar above shows the Commercials (or Professionals) net position from 1987 to 2010, labeled ‘_Better COT’. It fluctuates from Short (negative) to Long (positive) but has an overwhelming Short bias.
Below ‘_Better COT’ is a second indicator that calculates the percentage of the time that the Professionals are “hedging”. I define hedging as going Short when the market rises and vice versa. For example:
- A farmer sees the price of his agricultural commodity rise. By going Short he “locks in” that price and hedges his exposure to falling prices.
- A manufacturer sees the price of his raw material fall. By going Long he “locks in” that price and hedges his exposure to rising prices.
- An importer sees his currency strengthening. By going Short he “locks in” that forex rate and hedges his exposure to a weakening currency.
- An exporter sees his currency falling (making him competitive). By going Long he “locks in” that forex rate and hedges his exposure to a strengthening currency.
In the chart above you can see that the Commercials spend most of their time hedging. The non-Commercials (typically large Hedge Funds) do the reverse and spend most of their time trend following. This pattern can be seen in all commodity and forex markets (see the video above).
But in strong trends Commercials start trend following
The other pattern that you see in the Commitment of Traders data is that when strong trends develop the Commercials flip from hedging to trend following.
This pattern is particularly pronounced in the S&P500 futures. The chart above shows that since 2000 the Professionals have started trend following three times:
- In 2000 at the start of the “Tech Wreck” market decline
- In 2003 at the start of the market recovery driven by low interest rates, and
- In 2007 at the start of the “Sub Prime” market crash
Then as the trend loses steam the Professionals switch back into hedging.
Here are 5 ways to use the Commitment of Traders data
Analysis of the Commitment of Traders data is secondary in my Emini trading. The data is only released weekly and I put more emphasis on price cycles, volume momentum and Professional activity. That being said, the Commitment of Traders data is useful in confirming over-bought/sold levels and identifying potential market turning points.
Here are my suggestions for using Commitment of Traders analysis in Emini trading:
- Use the SP (full-size) Commitment of Traders data not the ES (Emini)
- Use an Oscillator to identify over-bought and over-sold levels
- Keep an eye on the Stock Market Crash Indicator
- Follow related markets like Crude Oil and US Treasury Bonds, and
- Move your trading capital when long term Forex trends change
1. Use the SP Commitment of Traders data not the ES
If you’re an Emini trader you’ve got 5 Commitment of Traders data choices:
- Obviously data for the Emini (ES)
- Data for the large S&P500 contract (SP)
- Combined data for all the “mini” contracts (Emini, mini-Dow, mini-NASDAQ, etc.)
- Combined data for all the “full-size” contracts (S&P500, Dow, NASDAQ, etc.)
- Combined data for all the indices
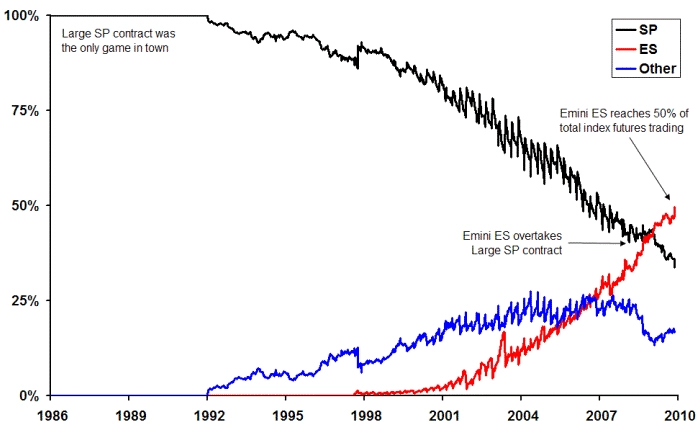
The chart above shows that in 2009 the Emini has not only overtaken the SP contract but has now become the largest component of the equity index futures market with just over 50% of total open interest. And yes, I’ve adjusted all the contracts for their relative margin size – so the Emini open interest data is divided by 5 so it’s directly comparable with the SP contract, etc.
So obviously you want to base your analysis on the Emini (ES) Commitment of Traders data, since it’s now the largest market? Well, “No” and here’s my reasoning.
Over the last 10 years several things have happened to the large contract (SP) market:
- Trading volume peaked in 1998 and has been in a slow, steady decline ever since
- Trading volume moved to the Emini (ES) contract with its electronic trading, lower margins, 24 hour trading, etc.
- Turnover (ratio of volume to open interest) in the SP also declined from 8 to 1.5
- After 2003, volume traded started to peak every 3 months with contract rollover
- During contract rollover months turnover was approximately 2.0 and during the other months turnover was approximately 1.0
These last two points are critical – they show that the large contract (SP) has become the de-facto position trading vehicle. An SP position is entered and typically held for a month and only occasionally rolled over at contract expiry.
By contrast, the Emini contract (ES) has seen the following evolution over the last 10 years:
- Trading volume continues to grow steadily and is now averaging approximately 2 million contracts daily
- Emini (ES) trading volume is now 13 times larger than the large contract (SP) – adjusted for margin
- Turnover (ratio of volume to open interest) in the Emini has been steady since 2003 at approximately 18 times, and
- The quarterly volume peak with contract rollover (seen in the SP) is much less pronounced
So Emini (ES) turnover is approximately 18 times, compared with approximately 1.0 times for the large contract (SP) in non-rollover months. The Emini (ES) has become almost exclusively a day trading vehicle.
And you can see the differences in the COT data …
The chart above includes the ‘Better’ COT Indicator that shows the Professionals’ position. The large contract (SP) Professionals has relatively large and smooth swings. However, the Emini contract (ES) Professionals has smaller swings that appear almost random from week-to-week. This shows that the Emini Professionals are less directionally committed and reinforces that the Emini is almost exclusively a day trading vehicle. And the other “mini” contracts show a similar pattern.
Since the large SP contract is used more for position trading and hedging, you’re better off basing your Commitment of Traders analysis on the large S&P contract (SP) data and ignoring the Emini (ES) data.
2. Use an oscillator to identify over-bought & over-sold
The usefulness of the Commitment of Traders data comes when you combine it with price. I use a clever little algorithm to compare changes in price with changes in the Commitment of Traders data. This generates an Oscillator which shows me when the Professionals consider a market to be over-bought or over-sold.
The chart above shows the Oscillator applied to weekly data for the large SP contract. As you can see it tracks market swings nicely. The red and white dots on the weekly price bars are superimposed after the Oscillator crosses the zero line to mark the high or low point of each swing.
3. Track the Stock Market Crash Indicator
The pattern mentioned earlier of Professionals switching to trend following, once a strong trend develops, can be used to create a Stock Market Crash Indicator that warns of potential corrections and crashes.
For the indicator to signal the following sequence of events needs to take place:
- Stock market makes a new 52 week high while the Commercials are net Long
- The Commercials flip from net Long to net Short
- A “Warning” signal is printed on the chart, and
- The signal is confirmed once the market drops 10% from the high
Simple, but very effective. Check out the chart above that shows the market corrections from 2007 to 2010. Crash warning signals were generated before each one.
For more information watch: When Will the Stock Market Crash?
4. Follow related markets like Crude and Bonds
Now that the Commitment of Traders data is accessible within TradeStation, it’s easy to apply the COT indicators to other markets. From an Emini trading perspective, the most important markets to follow are Crude Oil and US Treasury Bonds.
Crude Oil is a proxy for global growth and global growth results in corporate profits and rising stock markets. So the stock market and Crude Oil are directly correlated. Crude Oil is also a hedge for the US Dollar – so when the Dollar falls, Crude rises.
The relationship between the Bond and stock markets is more complex. Sometimes they are directly correlated and sometimes they are not. When investment prospects are good, capital flows into both equities and Bonds and they’ll both rise together.
However, when perceived risks are high, investors will prefer Bonds over equities. Nonetheless, turning points in the Bond market often lead the stock market and so the Bond market is worth following. The chart above shows the Better COT Oscillator on both Crude Oil and Bonds.
5. Move your trading capital with Forex trends
Lastly, I don’t trade Forex, however, I don’t want to keep my trading capital in a weak currency. Once or maybe twice a year I move my trading capital into what I perceive to be the strongest currency. Investment professionals call this a “currency overlay”.
For that reason I keep an eye on the major currencies: US Dollar, Euro, British Pound, Japanese Yen and Australian Dollar. When I see major shifts, for example into or out of the US Dollar, I move my capital accordingly.
The chart above shows a useful Divergence indicator that compares the Commitment of Traders data with the underlying futures market. The indicator is based on the Better Momentum divergence algorithm but is still a work in progress.
(Note the Commitment of Traders data has been inverted in the chart above.)
Summary
This article should have convinced you to:
- Follow the Professionals. The Commitment of Traders report tells you what the Professionals (classified as ‘Commercials’) are doing. Invaluable information.
- Use the “full-size” SP contract. If you trade Eminis don’t follow the Emini (ES) Commercials, the “full-size” (SP) Commercials are a more reliable indicator.
- Use an oscillator to identify over-bought/sold. Over-bought/sold levels can be identified by comparing changes in price with changes in the Commercials’ net position. Follow the S&P directly as well as related markets such as Crude Oil, Bonds and the US Dollar.
- Use the Stock Market Crash Indicator. Remember, the Professionals have been short the market before every stock market crash from 1987 onwards. Big clue.
- Move your trading capital with Forex trends. Why keep your trading capital in a weak currency? Be pro-active and watch the Forex big picture.
Commitment of Traders Indicators for TradeStation
Click on the button below to download some free Commitment of Traders indicators in TradeStation EasyLanguage format, with text versions included as well.
Click this link for more free indicator code.