Free Indicators
A Collection of Free Indicators for TradeStation, etc.
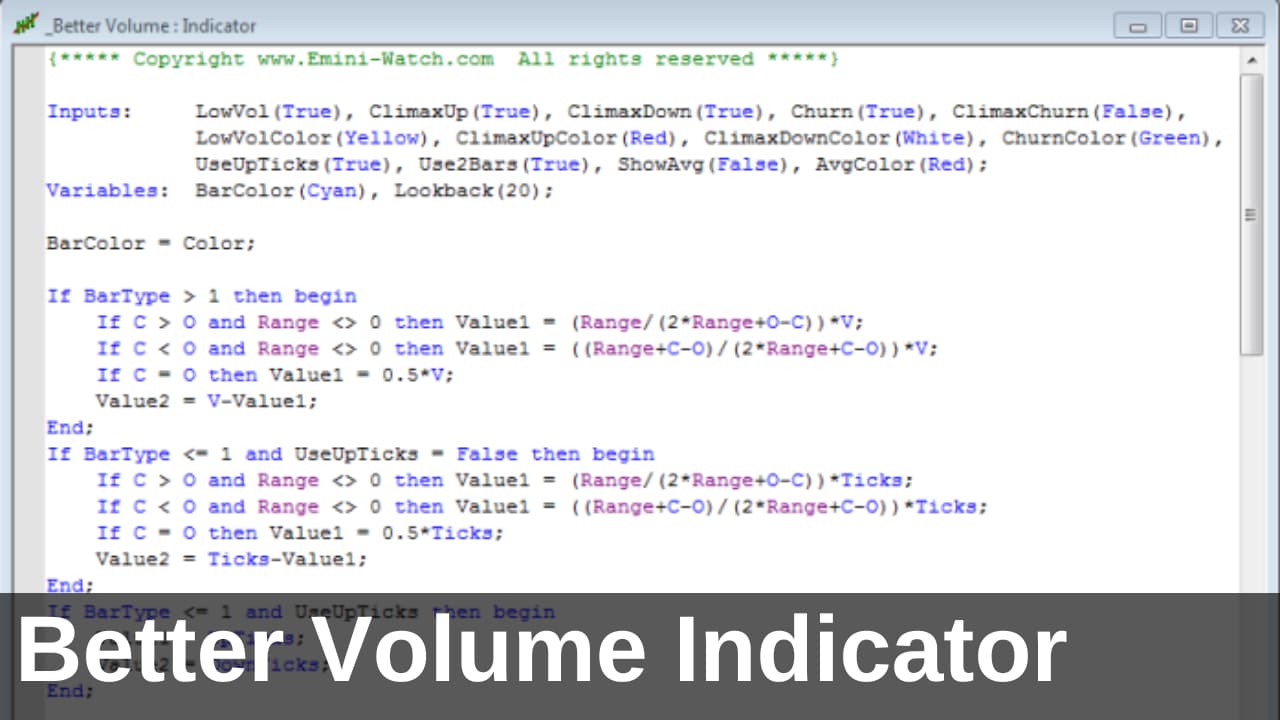
The Better Volume Indicator [Free Code]
Most traders ignore volume. Big mistake! Big! Huge! Volume has to be the most underrated market variable used in technical analysis. But if you know how to analyze and interpret it, you’ll be able to see market turning points develop and anticipate pullbacks and trend changes. You can figure out ...
The Better Rotation Indicator [Free Code]
The Better Rotation Indicator uses 8 major ETFs to track Global Macro trends. This indicator helps visualize the rotations from one Global Macro asset class to another – from unloved and over-sold to hot and being chased by the herd. Right now (4Q 2016) we’ve got a rotation taking place ...
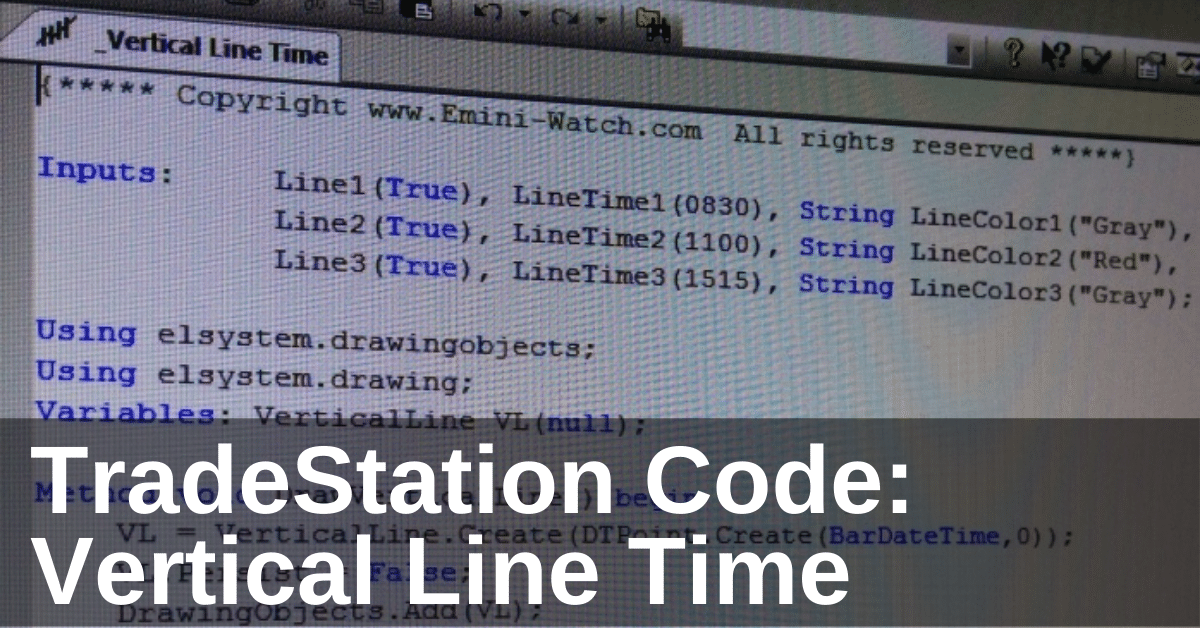
The Vertical Line Time Indicator [Free Code]
Here’s a free TradeStation indicator that uses the new drawing object classes to plot vertical lines on your charts at any time you want. I use the indicator to mark the four most important times of the trading day/week: You can adjust the indicator inputs to plot the four lines ...

The Better X Trend Indicator [Free Code]
Here’s how to use explosion and exhaustion volume to determine the trend. Introducing the Better X Trend Indicator. Trend indicators are the holy grail of the indicator world – everyone thinks “If only I had a better trend indicator then making money in the market would be easy.” But trend ...
The Stock Market Seasonality Indicator [Free Code]
Stock market seasonality definitely exists, but can you use it for day trading? I think the answer is “Yes” – but only where there is strong fundamental support. Looking for annual statistical anomalies just isn’t enough. Just because on average the market did “this” (up/down x% on this particular day) ...
The Stock Market Crash Indicator [Free Code]
When will the stock market crash? Everyone would like to know the answer to that question! Large Contract (SP) Data No Longer Available On 30 September 2021 the large S&P500 contract (symbol: SP) ceased trading. The Stock Market Crash Indicator featured in this video and article is based on this ...
The Better Commitment of Traders Indicator [Free Code]
Commitment of Traders (COT) data is not the holy grail – but can be immensely useful in longer term analysis. Here’s how. I tested all the different combinations and found that your method of futures only, all large contracts and net % had the best profit factor. I was really ...
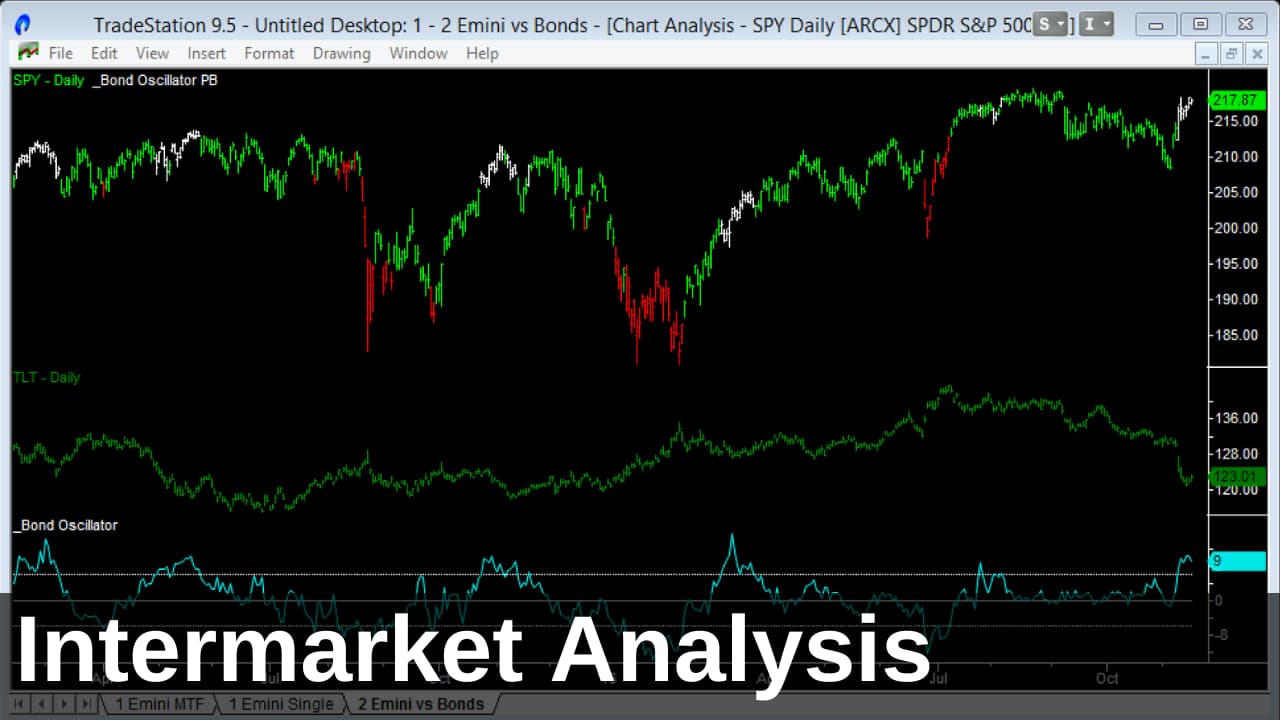
The Intermarket Oscillator [Free Code]
Can the technical analysis of one market help you trade another? Yes, maybe. Intermarket Analysis is the comparison of potentially related markets. For example: Often you’ll see two markets moving together – one seemingly driving the other. These moves can last weeks or months and will be pointed to by ...
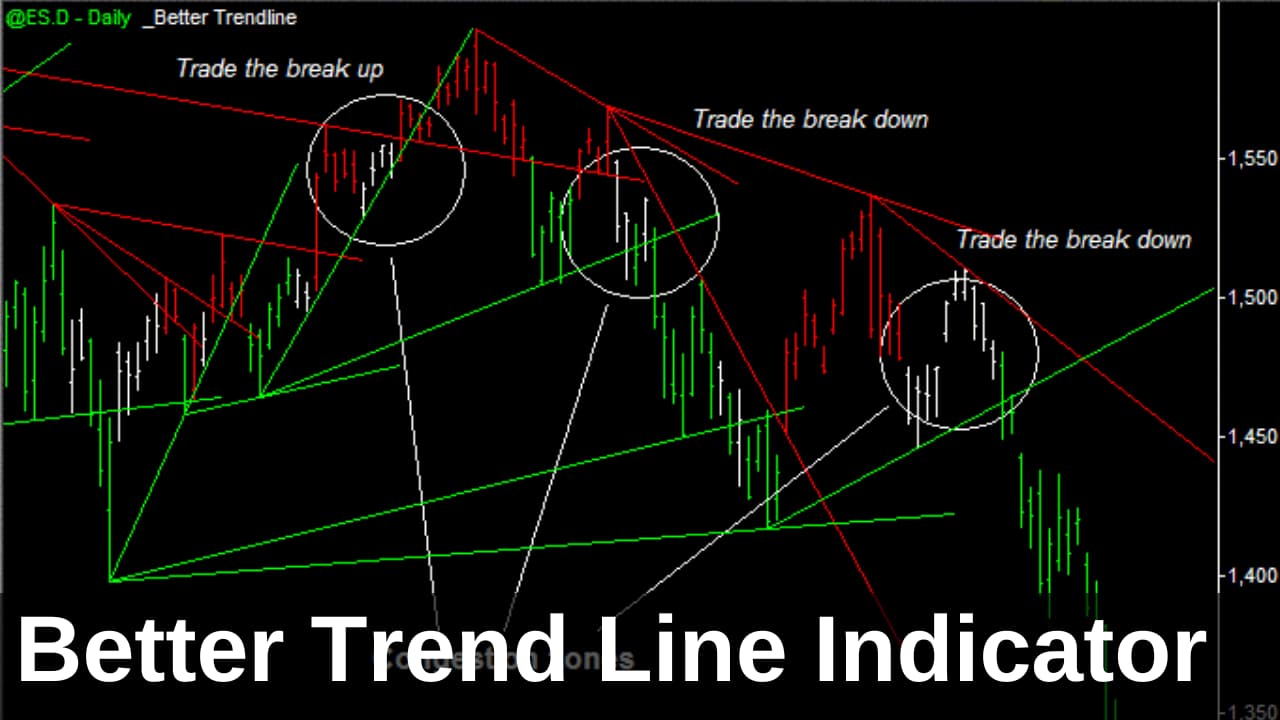
The Better Trend Lines Indicator
“The Big Money is in The Big Moves.” Better Trend Lines is a very simple and elegant indicator that signals uptrends, downtrends and market consolidation zones. Trade entries are signalled when the market breaks out of a consolidation zone, into a trending phase. Real breakouts will move fast and without ...
The Better TRIN Indicator
The TRIN Index (or Trading Index or Arms Index) is a measure of stock market strength, originally developed by Richard Arms in 1967. It is one of the few truly leading (as opposed to lagging) stock market indicators and is widely followed by market analysts. TRIN Index data is available ...