

Quick Answer
Futures are the best overall way to trade with leverage on a $10,000 account. I ranked eleven ways to put on the same trade - long the S&P 500 at 7,500, take profit at 8,000, sitting through a dip to 7,150 - using real market quotes from 23 July 2026 and after-tax results for a US trader. Micro Emini futures (MES x 2) returned +$3,614 after tax with no expiry date and no wipeout risk. Out-of-the-money calls returned slightly more (+$3,779) but lose everything if the market closes below the strike at expiry. The worst performer, plain SPY, made just +$507. Same market call, a 7-to-1 spread in results - the instrument you choose matters as much as the trade itself.
Table of Contents
The Trade
One scenario, eleven instruments, identical rules:
- Entry: S&P 500 at 7,500. Target: 8,000 (+6.7%)
- The catch: the market dips to 7,150 first (-4.7%), then rallies over roughly 3 months
- Exit rule: every position is liquidated the moment the market touches 8,000
- Account: $10,000. US trader. ETF gains taxed at a 24% marginal rate; futures and cash index options at the Section 1256 blended rate of 18.6%
- All prices are real quotes from 23 July 2026. Commissions and slippage excluded (they are small and do not change the ranking)
One rule before anything else: chart the most liquid market - the Emini (ES) - and take the trade in whichever instrument fits your risk:reward. Your analysis and your execution do not have to live in the same product.
Are Futures Better Than Options?
For most traders, on most trades: yes. Here is the head-to-head from this test, after tax:
| MES futures x 2 | OTM 7750 calls x 3 | |
|---|---|---|
| After-tax profit at 8,000 | +$3,614 | +$3,779 |
| Drawdown at the 7,150 dip | -$3,500 (survives margin by $220) | -$4,365 (no margin call possible) |
| Market stalls at 7,900 | +$3,440 (gross - barely cares) | -$3,065 (the winner becomes the loser) |
| Market closes below 7,750 at expiry | still holding, linear loss | -$7,565 total loss |
| Expiry date | none, assume roll | 15 Jan 2027 |
The options trade wins by $165 in the one scenario where everything goes to plan - and pays for that edge with a total-loss cliff that starts 250 points above the entry price. Futures are linear: right by 400 points instead of 500 and you still collect most of the profit. Options are convex: they live or die on the strike.
Options earn their place in two situations: when you cannot risk being shaken out of a drawdown (a long call cannot be margin-called), and when you can forecast the size of a move, not just its direction.
Do Leveraged ETFs Decay?
Yes - and the decay grows with the square of the leverage. This is the part most explanations get wrong, including the simple version I gave in the video, so here is the full mechanism.
Start with plain compounding: down 10% then up 10% is not flat. $100 drops to $90, and 10% back up only reaches $99. That 1% round-trip loss applies to any investment, including plain SPY.
Now add the leverage. A 2x daily-reset fund turns that path into down 20%, up 20%: $100 to $80 to $96. Down 4% - four times the drag for double the leverage. A 3x fund: down 30%, up 30% = $100 to $70 to $91 - down 9%, nine times the drag. The penalty scales with leverage squared, and it is charged on every wobble because the fund resets to its multiple daily - mechanically buying exposure after up days and selling after down days.
On this test’s mild V-shaped path: SSO (2x) captured +12% instead of the naive +13.3%, and UPRO (3x) captured +16.5% instead of +20%. TQQQ - triple leverage on the higher-beta Nasdaq - gave up over 5 points (+18.8% vs a naive +24%). And this scenario is the gentlest test a leveraged ETF ever sits; real day-to-day chop grinds the reset toll continuously. Add ~1% management fees and full marginal-rate tax, and the “3x” fund delivered 1.9x effective leverage after tax.
One correction to the video worth making here: leveraged ETFs do not take a meaningfully bigger loss than 2x or 3x the index on a straight decline - the stop-out losses in the table below are almost exactly the naive multiple. The decay penalty is charged on the recovery leg, where the fund has to climb out of the hole from a shrunken base. Down the elevator at full leverage, back up the stairs with a handicap.
What Trades Were Actually Taken?
Every position with its buy and sell price, so you can audit the maths. Options are XSP (the 1/10th-size cash-settled S&P index option), quoted per point with a $100 multiplier - a 39.86 quote costs $3,986 per contract. Futures are quoted in index terms with the ~50 point carry (the financing built into the futures price) deducted separately. Option sell prices are the position’s value when the index touches 8,000 roughly 3 months in, with 2.8 months of option life remaining.
Because the options are sold with 2.8 months of life remaining, they fetch more than their intrinsic value - the buyer pays for the unexpired time value (what options traders call extrinsic value). That is why the ATM calls sell at 60.53 when only 50 points are intrinsic: the extra 10.53 points is time premium sold back to the market. It is also why you sell an option rather than exercise it - exercising captures only the intrinsic and throws the rest away. The one position where this works against you is the call spread, where closing early means buying back the short leg’s remaining time value.
| # | Instrument | Qty | Buy | Sell | Gross P&L | After tax |
|---|---|---|---|---|---|---|
| 1 | SPY | 13.33 sh | 750.00 | 800.00 | +$667 | +$507 |
| 2 | QQQ | 16.39 sh | 610.00 | 658.80 | +$800 | +$608 |
| 3 | SPY on 2x margin | 26.67 sh | 750.00 | 800.00 | +$1,183 (after $150 interest) | +$899 |
| 4 | SSO (2x) | $10,000 | - | +12.0% | +$1,200 | +$912 |
| 5 | UPRO (3x) | $10,000 | - | +16.5% | +$1,650 | +$1,254 |
| 6 | TQQQ (3x) | $10,000 | - | +18.8% | +$1,880 | +$1,429 |
| 7 | MES x 2 (IBKR) | 2 | 7,500 | 8,000 | +$4,440 (net of ~$280/contract carry) | +$3,614 |
| 8 | MES x 3 (TradeStation) | 3 | 7,500 | 1 force-sold at 7,335, 2 at 8,000 | +$3,520 | +$2,865 |
| 9 | MNQ x 1 (IBKR) | 1 | ~23,100 | ~24,950 | +$3,000 (net of carry) | +$2,442 |
| 10 | XSP ATM 7500 call | 2 | 39.86 | 60.53 | +$4,135 | +$3,366 |
| 11 | XSP OTM 7750 call | 3 | 25.22 | 40.69 | +$4,643 | +$3,779 |
| 12 | XSP deep-ITM 7000 call | 1 | 76.73 | 106.50 | +$2,980 | +$2,426 |
| 13 | Call spread - long 7500 leg | 3 | 39.86 (buy to open) | 60.53 (sell to close) | +$6,201 | - |
| Call spread - short 8000 leg | 3 | 24.15 (buy to close) | 14.29 (sell to open) | -$2,958 | - | |
| Call spread - net | 3 | 25.57 debit | 36.38 credit | +$3,245 | +$2,641 |
Note: SPY and QQQ share counts assume fractional trading (IBKR, Fidelity, Schwab and others support it; TradeStation does not). Option sell prices are based on Black-Scholes modeling using each strike’s own implied volatility from the live chain.
Two things this fill sheet shows that no textbook does. First, the short leg of the spread lost money doing its job - sold at 14.29, bought back at 24.15 - because at the moment the index touches 8,000 that leg is exactly at the money and stuffed with time value. Held to the January expiry instead, it expires worthless, and the spread’s profit jumps to +$7,330 gross. Second, contract lumpiness means no options position could deploy the full $10,000 - between $2,029 and $2,435 sat idle in every options variant. On a small account, contract size itself is a tax on options.
What Happened With the Margin Call?
The MES x 3 position at TradeStation is the cautionary tale. TradeStation’s overnight margin ($2,758) let three contracts through the door that IBKR ($3,452) would have rejected. But the margin engine marks the account continuously: at 7,335 - just 165 points into a perfectly normal dip - equity breached maintenance and one contract was force-sold automatically for a -$825 realised loss. The remaining two rode to 8,000, but the trade finished $920 behind the correctly-sized two-contract version.
The rule this teaches: the trade’s expected drawdown - not your account size - sets your maximum contracts. And at high leverage you do not own your stop; the margin formula does.
What Is the “Cliff” in Options Trading? The 7,900 Stall Test
The cliff is the zone where an option delivers a total loss even though the market moved in your favour - and it sits closer to success than most traders realise. To show it, re-run the whole test with one change: the market grinds up to 7,900 but never touches 8,000, and the options are held to their January expiry.
At expiry, an option is worth only its intrinsic value - the amount it is in the money. Every dollar you paid above that was time value, and time value expires at exactly zero. That single fact re-ranks the entire board:
| Instrument | Stall at 7,900 (before tax) | Why |
|---|---|---|
| 7500/8000 call spread x 3 | +$4,330 (now #1) | Long leg worth 400 points intrinsic; the short 8000 leg expires worthless, so its premium is kept in full |
| MES futures x 2 | +$3,440 | Linear - collects 400 of the 500 points and barely notices |
| Deep-ITM 7000 call | +$1,327 | 900 points of intrinsic value more than covers the premium |
| ATM 7500 calls x 2 | ~$0 breakeven | 400 points of intrinsic almost exactly repays the 399-point premium |
| OTM 7750 calls x 3 | -$3,065 | Only 150 points intrinsic against a 252-point premium paid |
| SPY | +$533 | A win, but small |
Three mechanics explain the table:
1. An option’s real breakeven is strike plus premium, not the strike. The ATM 7500 call cost 39.86 points, so it needs the market above ~7,899 just to return your money. The OTM 7750 call cost 25.22 points, pushing its breakeven to 8,002 - above the trade’s own take-profit target. That is the cliff in one sentence: the OTM trade required the market to overshoot the plan just to break even.
2. The total-loss zone can sit above your entry price. The OTM calls expire worthless anywhere below 7,750 - meaning the market can rally 249 points from entry, a 3.3% gain, and the position still loses 100% of the $7,565 paid. The ATM calls and the spread need the market below 7,500 (back at entry) for total loss; the deep-ITM call needs 7,000. Where the death zone sits is a choice you make when you pick the strike.
3. The same stall that kills the OTM call pays the spread. The spread sold the 8000 call - the level the plan was going to exit at anyway - and in the stall world that sold leg expires worthless, its premium fully banked. One instrument’s fatal scenario is the other’s best case, built from the same two strikes.
This is the biggest difference between futures and options. Futures are linear: right by 400 points instead of 500, you collect 80% of the profit. Options are convex: they pay enormously when you are right about direction, size, and timing together.
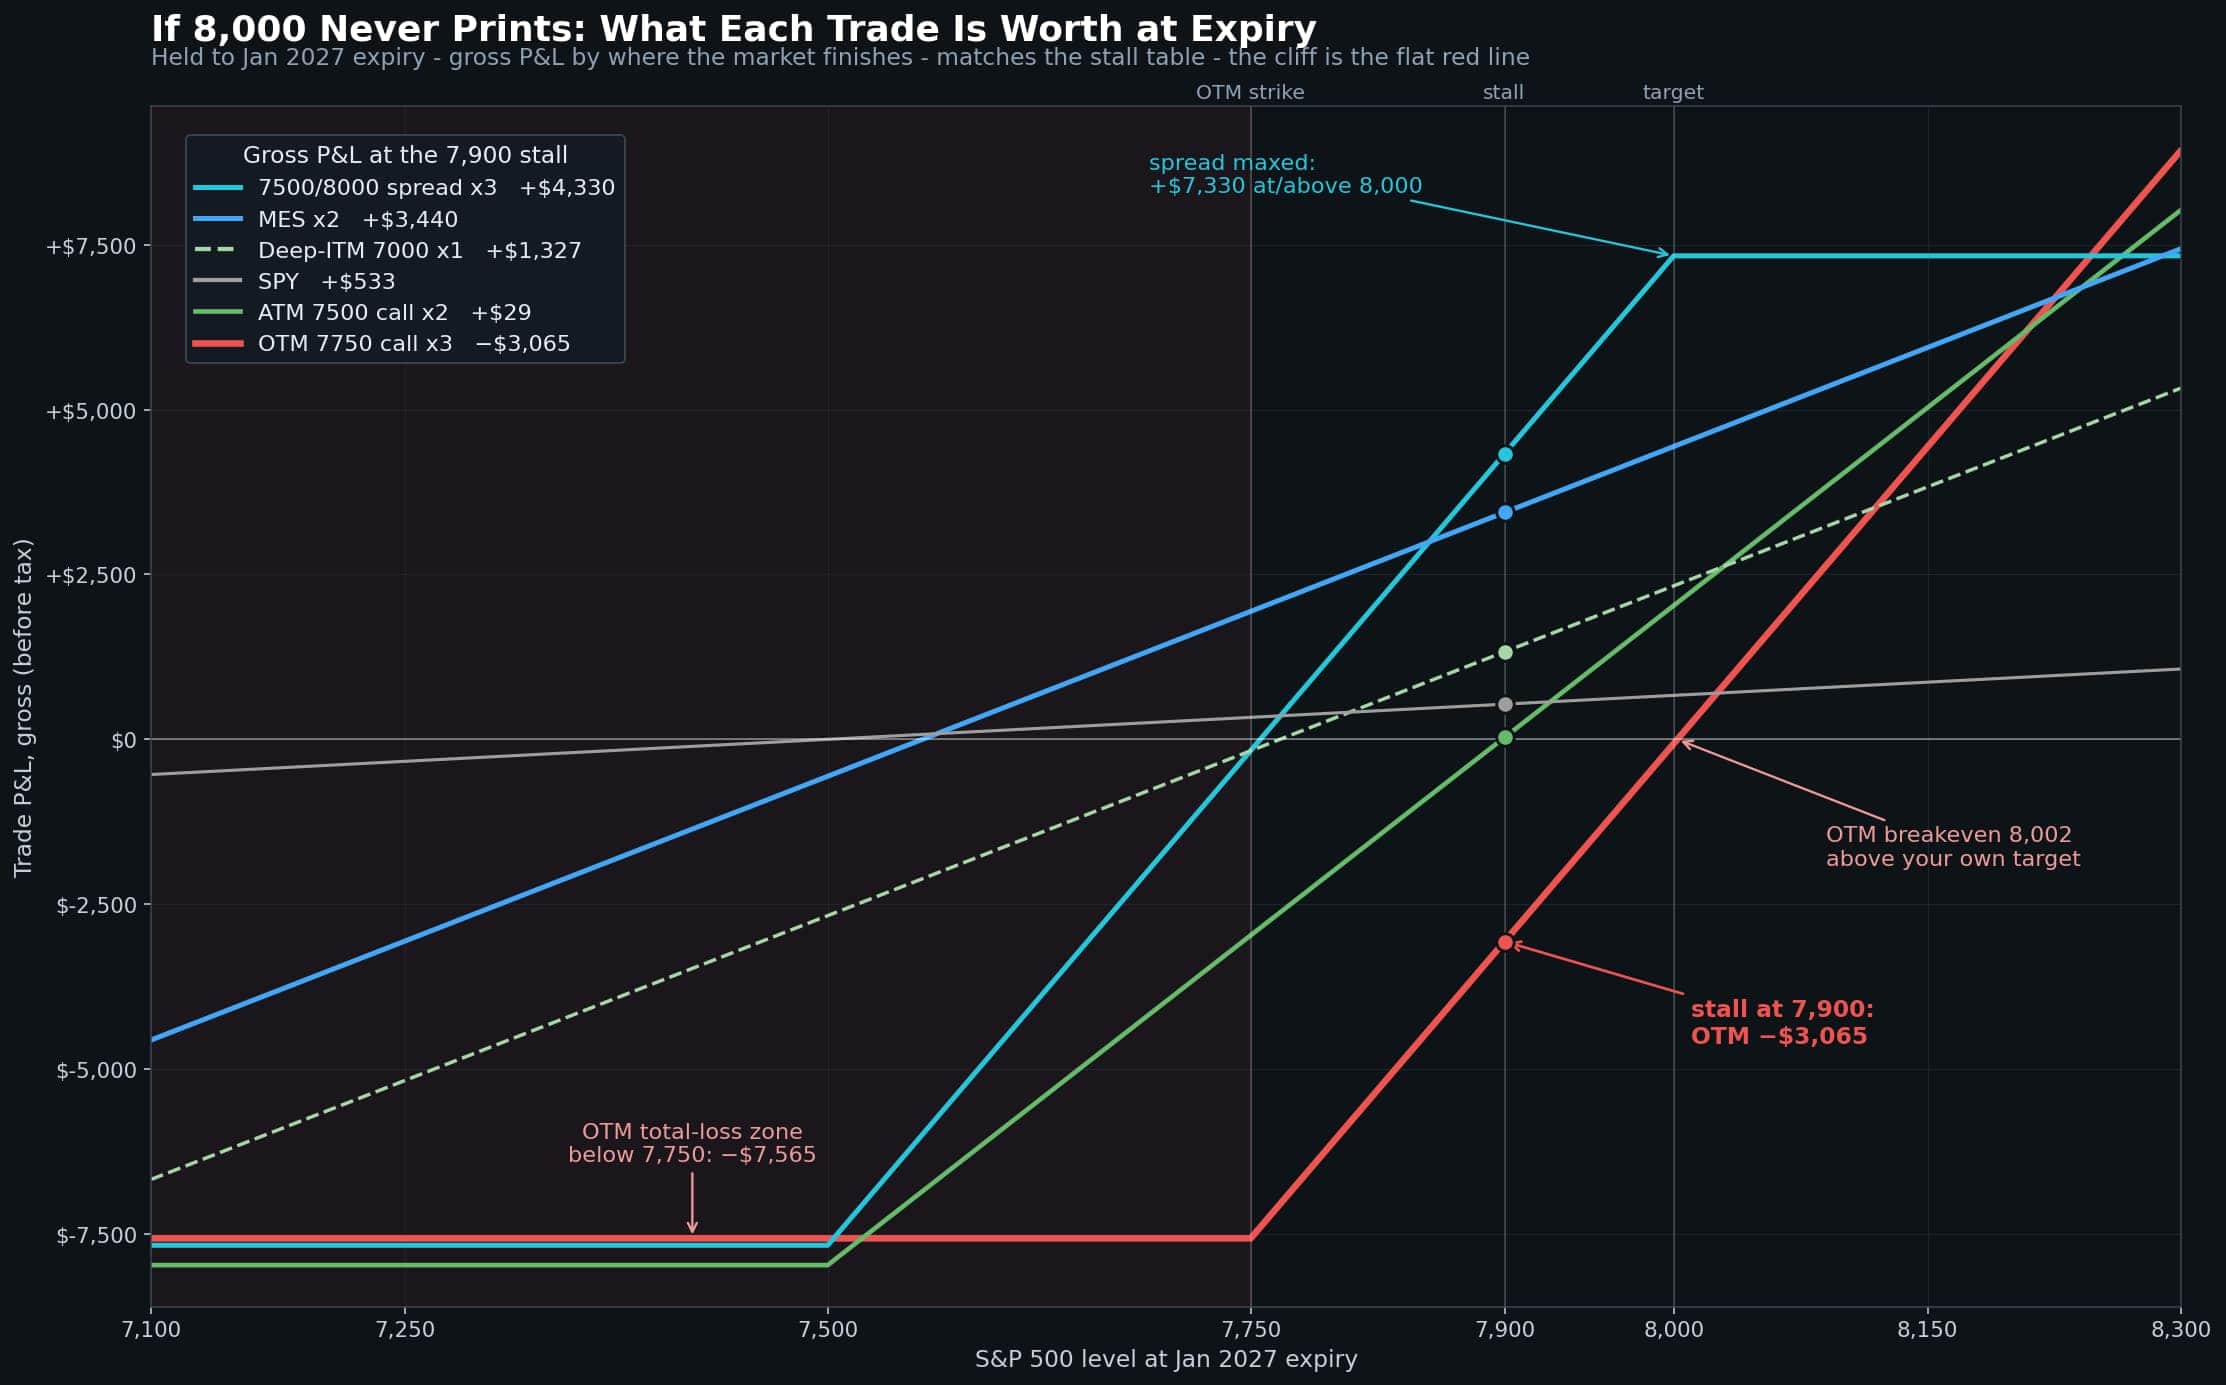
The OTM calls that topped the scorecard become the worst trade on the board when the market falls 100 points short. There is no best instrument, only the instrument whose failure case you can live with.
What Is the Risk:Reward of Each Instrument?
Same trade with a hard stop at 7,100: risking 400 points to make 500, a pure risk:reward of 1.25. Every layer of structure - interest, decay, premium, carry, forced liquidation - only erodes that number. Think of the final column as a structural efficiency score:
| Instrument | Gross return | Stop-out loss | R:R |
|---|---|---|---|
| SPY | +$667 | -$533 | 1.25 |
| QQQ | +$800 | -$640 | 1.25 |
| SSO (2x) | +$1,200 | -$1,067 | 1.12 |
| MES x 2 | +$4,440 | -$4,000 | 1.11 |
| 2x margin (incl. interest) | +$1,183 | -$1,117 | 1.06 |
| UPRO (3x) | +$1,650 | -$1,600 | 1.03 |
| MNQ x 1 | +$3,000 | -$2,900 | 1.03 |
| OTM 7750 calls x 3 | +$4,643 | -$4,560 | 1.02 |
| ATM 7500 calls x 2 | +$4,135 | -$4,170 | 0.99 |
| TQQQ (3x) | +$1,880 | -$1,920 | 0.98 |
| 7500/8000 spread x 3 | +$3,245 | -$3,320 | 0.98 |
| Deep-ITM 7000 call | +$2,980 | -$3,210 | 0.93 |
| MES x 3 (1 lot trimmed at 7,335) | +$3,520 | -$4,827 | 0.73 |
Nothing beats the unleveraged geometry. Leverage scales the bet; it cannot improve the odds. The whole game is choosing the smallest structural toll for the risk shape you want - no liquidation, defined loss, capped upside, no expiry - because every shape has a price.
How Are Futures and Options Taxed Differently?
Section 1256 of the US tax code is the quiet multiplier in this whole ranking. Futures and cash-settled broad-based index options (XSP, SPX, and options on futures) are taxed 60% at the long-term rate and 40% at the short-term rate regardless of holding period - a blended 18.6% at the 24%/15% brackets assumed here. ETFs held under a year, and options on ETFs like SPY, pay the full marginal rate.
The trap: SPY options and XSP options track the same 500 companies within pennies, but SPY options are legally equity options (exercise delivers ETF shares) while XSP settles in cash against the index. The identical ATM trade in SPY calls instead of XSP calls would have taken home $223 less. Ticker choice is a tax decision. Section 1256 losses can also be carried back 3 years against prior 1256 gains - equity option losses cannot. (Not tax advice - brackets vary; the arithmetic does not.) For the wider picture on structuring a trading operation, see are there any tax loopholes left for traders.
The Scorecard
Leverage = after-tax return on the $10,000 account divided by the market’s +6.67% move.
| Rank | Instrument | Deployed | Gross | After tax | Leverage |
|---|---|---|---|---|---|
| 1 | OTM 7750 calls x 3 | $7,565 | +$4,643 | +$3,779 | 5.7x |
| 2 | MES futures x 2 | $6,904 margin | +$4,440 | +$3,614 | 5.4x |
| 3 | ATM 7500 calls x 2, no stop | $7,971 | +$4,135 | +$3,366 | 5.0x |
| 4 | MES x 3 (1 lot force-sold) | $8,274 margin | +$3,520 | +$2,865 | 4.3x |
| 5 | 7500/8000 spread x 3 (at touch) | $7,670 | +$3,245 | +$2,641 | 4.0x |
| 6 | MNQ micro future x 1 | $6,479 margin | +$3,000 | +$2,442 | 3.7x |
| 7 | Deep-ITM 7000 call | $7,673 | +$2,980 | +$2,426 | 3.6x |
| 8 | TQQQ (3x) | $10,000 | +$1,880 | +$1,429 | 2.1x |
| 9 | UPRO (3x) | $10,000 | +$1,650 | +$1,254 | 1.9x |
| 10 | SSO (2x) | $10,000 | +$1,200 | +$912 | 1.4x |
| 11 | 2x margin (interest deducted) | $20,000 exposure | +$1,183 | +$899 | 1.3x |
| 12 | QQQ | $10,000 | +$800 | +$608 | 0.9x |
| 13 | SPY | $10,000 | +$667 | +$507 | 0.76x |
The scorecard shows one snapshot: every trade graded at the 8,000 target. But a ranking at a single price hides how each instrument behaves on the way there. The chart below plots the same thirteen trades across every level from the 7,100 stop to the 8,000 target - each line ends at exactly its scorecard number on the right edge, but the journey tells you what the table cannot: how deep each trade sits underwater at the dip, where it crosses into profit, and how steeply it pays as the market climbs. The steeper the line, the more leverage; the lower its left end, the more pain you must sit through to collect.

The Verdict
Best overall: futures. No expiry, no decay, survives the dip when sized right, Section 1256 treatment, and within $165 of the top return without a wipeout tail.
Best absolute return: OTM calls - if you can call the direction and the size of the move. Miss by 100 points and it becomes one of the worst trades on the board.
Best if you are patient: the call spread - it sells the level you were going to exit at anyway, and it wins outright if the market stalls short of the target.
Three sizing lessons: the drawdown - not the target - sets your maximum size. The more structure an instrument carries, the less efficient the trade. And idle capital is not a waste - it is the cushion that lets you sit through the drawdown without a margin call.
FAQ
Are futures better than options for small accounts?
Usually. On a $10,000 account, futures deploy exposure precisely (2 micro contracts used $6,904 of margin) while every options position stranded $2,000+ of capital due to contract lumpiness. Futures also carry no expiry date and no total-loss strike. Options win when you specifically need immunity from being shaken out of a drawdown, or a defined maximum loss.
Do leveraged ETFs decay?
Yes. Daily-reset compounding costs a 2x fund roughly 4x the round-trip drag of the underlying index and a 3x fund roughly 9x, because the penalty scales with leverage squared. In this test, SSO delivered +12% against a naive +13.3%, and TQQQ delivered +18.8% against a naive +24% - on a gentle path. Choppy markets are worse.
What is Section 1256?
The US tax rule giving futures (ES, MES) and cash-settled broad-based index options (XSP, SPX) a blended 60% long-term / 40% short-term treatment regardless of holding period - 18.6% at the brackets assumed here, versus 24% on ETFs and SPY options held under a year. It also allows 3-year loss carryback.
What happens if the market stalls below the target?
It re-ranks everything. At 7,900 - one hundred points short - futures barely care; the call spread becomes the top trade, the ATM call breaks even, and the OTM calls that topped the scorecard lose $3,065. An option’s real breakeven is strike plus premium, so the total-loss cliff can sit above your entry price. Full breakdown in the stall test section above.
This analysis uses real quotes from 23 July 2026 and is educational content, not trading or tax advice.
If you trade the Emini with futures, the next step is knowing when the professionals are buying and selling. That is what the Better Indicators are built for - see how they work here.