Trading Blog
Videos and Guides on Emini and Futures Trading

Futures Margin Requirements
Live Data from Interactive Brokers and TradeStation What is the difference between initial margin and maintenance margin in futures trading? Initial margin is the amount a trader must deposit to open a futures position. Maintenance margin is the minimum account equity that must be maintained once the position is open. …

Volume Momentum Indicator: Why Price-Based Momentum Is Obsolete
Traditional momentum indicators measure price. But price is the result, not the cause. A volume momentum indicator measures buying and selling volume – the actual driving force that moves markets. That’s why I built Better Momentum. Better Momentum is my most valuable trading tool. Jack B. You make volume as …

Toughen Up, This Isn’t a Game for Crybabies
Warning – this video is not for everyone. If you’re feeling fragile or negative, please give it a miss. In a nutshell, what am I saying? And to lighten the mood a little – some typical Australian humour. Losing days or weeks are hard but if you love trading you’ll …

How I Use TradeStation for $18/Month as a Full-Time Futures Trader
Quick Answer TradeStation’s desktop platform is effectively free for non-professional futures traders who use a funded futures account rather than lease the software. With a non-professional futures account that meets TradeStation’s activity and commission conditions, all real-time CME Group futures data – CME, CBOT, COMEX, NYMEX – including Level 1 …
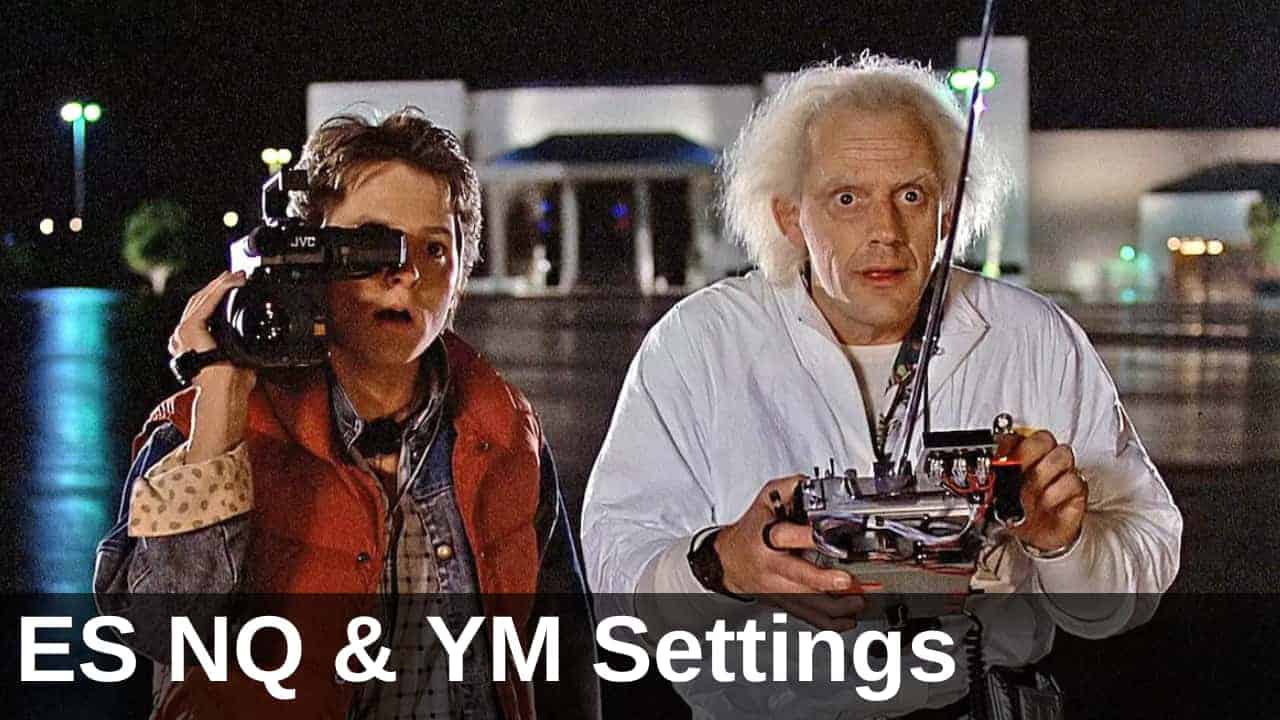
What Settings Should I Use for NQ, YM, TF & EMD?
The Emini (ES) is the largest of the “mini” index futures markets – with over 500,000 trades executed every day! But it’s not for everyone. Some traders love the extra volatility of the NASDAQ or the “smoother” trend moves of the Dow. If that’s you and you’d like to use …

Tick Charts Complete Guide: Settings & Platform Setup (2025)
Tick Charts are one of my “secret weapons”, and this article explains why. Tick Charts are not very well known and can be confusing. From time to time, I get questions about Tick Charts, and yesterday’s email from Ken was typical: I’ve been scouring the Internet for information on tick …

How to Setup and Read the ‘Better’ Emini Charts
The ‘Better’ Emini charts look a little different – not your traditional moving averages, Fibonacci retracements, RSI and MACD. The video above runs through how to setup the ‘Better’ indicator charts with the 3 non-correlated indicators (Better Sine Wave, Better Momentum and Better Pro Am). Then the video further down …

Trends in Lower Time Frames = Cycles in Higher Time Frames
Quick video today about trends and cycles using the Better Sine Wave indicator. I go through one of my favorite setups: End of Trend signals in the lower time frame chart synching up with Cyclical signals in the higher time frame chart. Remember: Trends in lower time frames are equivalent …

The ‘Better’ Indicators: The 5 Step Setup
OK, here it is. A little sneak-peak at the multiple timeframe setup. Same principles as always (exhaustion, divergence, price confirmation, Professional activity, etc.) but a more rigorous approach with 5 clear steps to the setup. And here’s an annotated screenshot: For a change in trend from uptrend to downtrend and …

Blown Trading Account! What Should I Do Now?
I received a very touching email from a follower, Michael (name changed): First, thank you very much for your website. I lost my whole account trading the Emini. I’m so upset. I don’t know how I should start again. Please, can you help? Rather than send Michael a quick response, …

The Stock Market Seasonality Indicator [Free Code]
Stock market seasonality definitely exists, but can you use it for day trading? I think the answer is “Yes” – but only where there is strong fundamental support. Looking for annual statistical anomalies just isn’t enough. Just because on average the market did “this” (up/down x% on this particular day) …

The Stock Market Crash Indicator [Free Code]
When will the stock market crash? Everyone would like to know the answer to that question! Large Contract (SP) Data No Longer Available On 30 September 2021 the large S&P500 contract (symbol: SP) ceased trading. The Stock Market Crash Indicator featured in this video and article is based on this …