Using Average Trade Size to identify Professional and Amateur activity is totally new – and I’ve never seen it mentioned anywhere before the introduction of Better Pro Am and it’s use on Emini-Watch. So if you want to get an edge in your trading, read on.
Knowing what the Pro’s are doing makes all the difference.
Herb C.
The Better Pro Am indicator is brilliant.
Mark L.
Better Pro Am really kicks ass.
KB
Table of Contents
Use the links above to jump to the Better Pro Am Indicator topics that interest you.
Professionals & amateurs can be identified by analyzing trade size
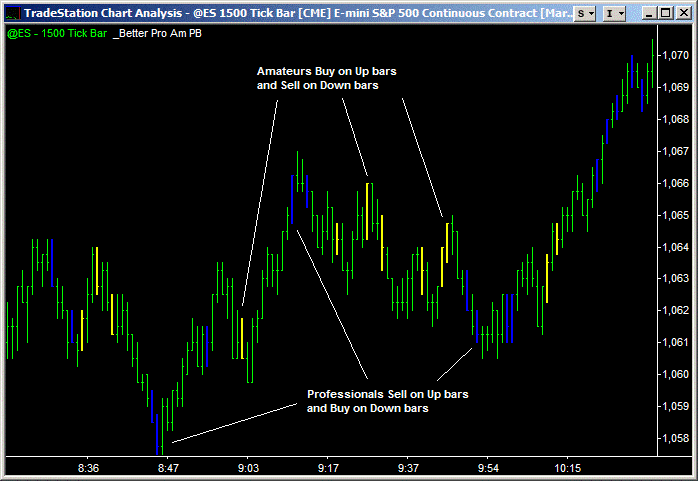
Professionals trade in size; Amateurs trade in singles and doubles. So analyzing average trade size directly identifies Professional and Amateur activity.
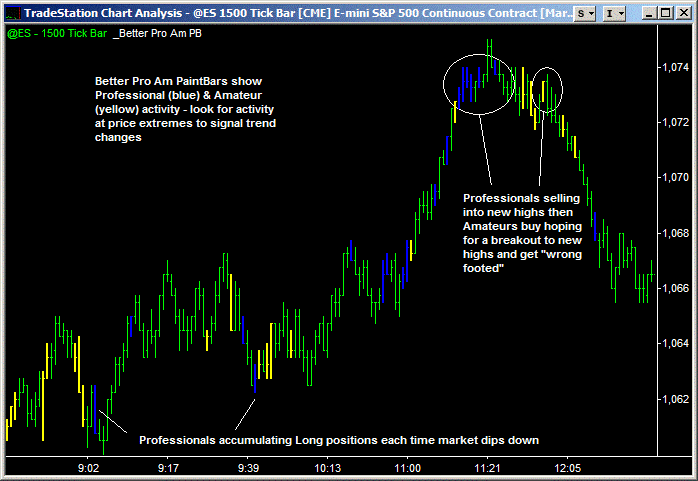
The Better Pro Am indicators use a proprietary algorithm to analyse average trade size and identify Professional and Amateur activity. Professional bars are painted blue and Amateur bars are painted yellow (default colors, can be changed).
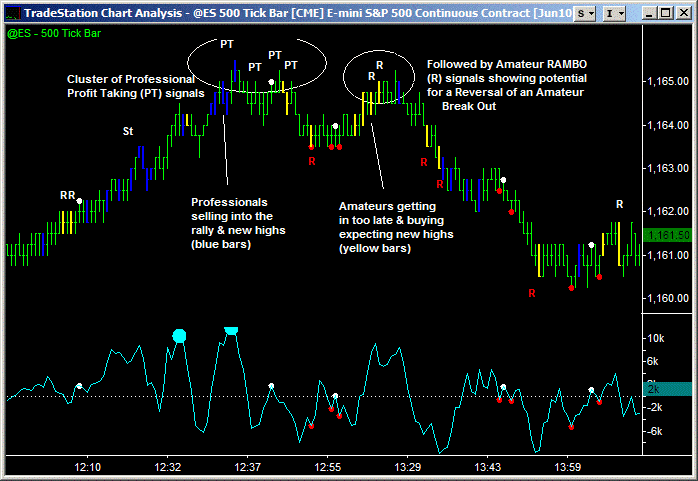
Professional activity can be used to identify market tops & bottoms
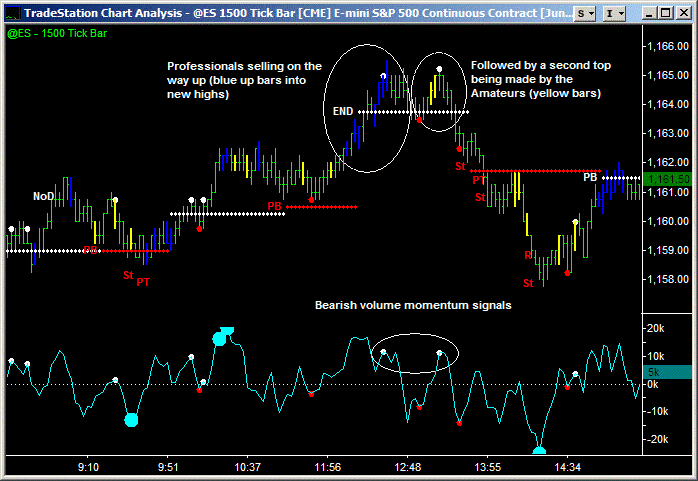
Since Professionals trade in size they need to buy new lows and on down bars and sell new highs and on up bars – before the trend changes. By contrast, Amateurs are always chasing the trend, buying breakouts or selling breakdowns – so doing the opposite of Professionals, buying new highs and on up bars and selling new lows and on down bars.
By looking for these Professional and Amateur volume patterns you can get a good sense of where the Professionals are entering trades and taking profits. In my trading I look for Professional and Amateur activity at price extremes and then watch to see how price reacts to determine trend changes.
This approach takes quite a lot of interpretation and practice – but it’s well worth it once you get the hang of it. A useful tip, to make things easier, is to ignore Professional and Amateur activity that occurs during price congestion and concentrate on price extremes.
And here’s one of the most requested video on Emini-Watch: How to Know if the Professionals are Buying or Selling
Note: The Professional and Amateur PaintBars are designed to be used on tick charts.
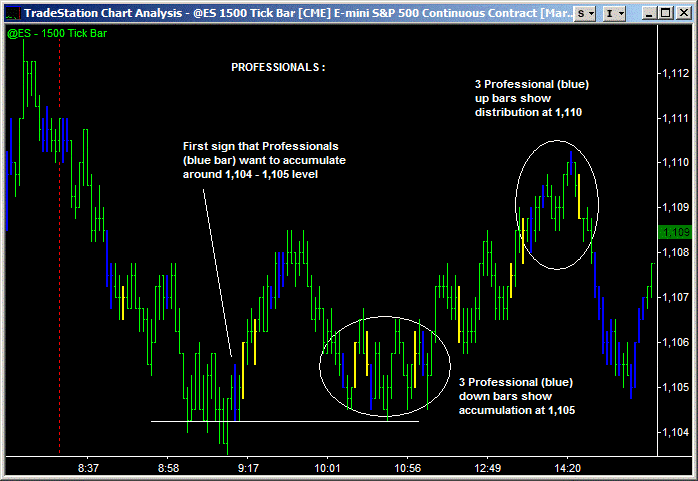
Professional accumulation & distribution patterns are seen early
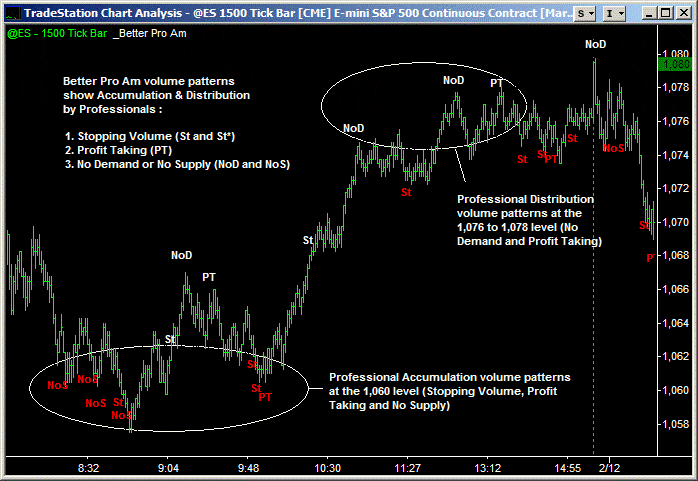
Included in the Better Pro Am indicators are 4 of my favorite volume patterns. Three of these volume patterns identify Professional Accumulation and Distribution:
- Stopping Volume (St and St* on chart)
- Profit Taking (PT on chart), and
- No Demand and No Supply (NoD and NoS on chart)
Stopping Volume and Profit Taking show Professionals are reversing their positions. However, the Professionals trade in size and need to scale in and out of positions. So these volume patterns are often seen before the market eventually reverses.
The No Demand and No Supply volume pattern is often seen at market tops and bottoms. It indicates there is a lack of buying volume at market tops to push price to new highs, or lack of selling volume at market bottoms. This volume pattern often confirms a change in trend.
In my own trading, I use clusters of these 3 volume patterns as confirmation of trend changes, not necessarily as entry signals.
Note: The Stopping Volume and No Demand/No Supply volume patterns included in Better Pro Am are improved versions of the free ones available on this website.
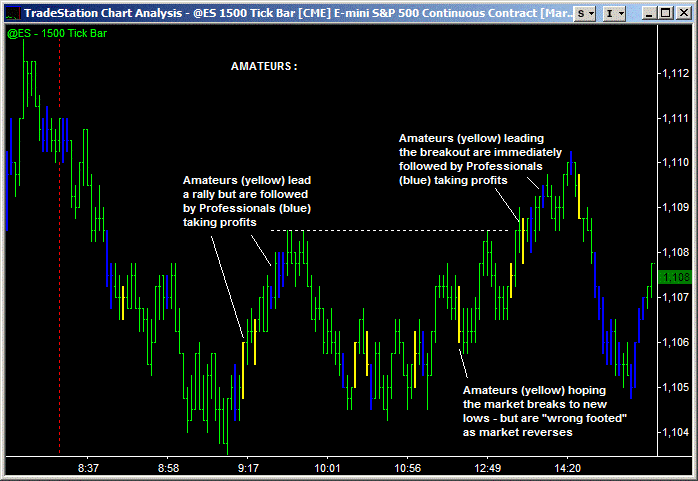
But amateurs usually get it wrong
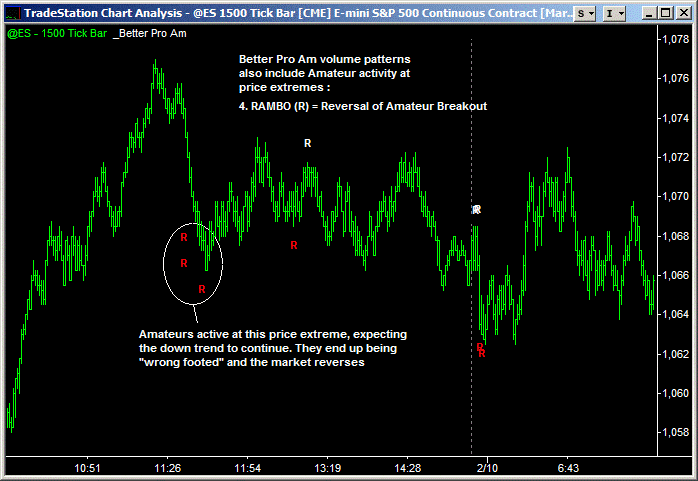
The fourth Better Pro Am volume pattern is called RAMBO – which is short for “Reversal of Amateur Break Out”. Marked on the chart with the text “R”.
The logic behind this volume pattern is that break outs led by Amateurs often fail. Amateurs are always chasing price, entering late and expecting a breakout from congestion to turn into a trend move. Professionals will fade this behavior, drive price back into congestion and gun the Amateur stops.
Volume patterns are best traded with confirming indicators
Nothing is perfect and I don’t believe you can trade with these Professional and Amateur volume patterns alone. However, in my own trading they are an essential part of confirming a change of trend and signaling entry points.
I use Better Sine Wave and Better Momentum to confirm high probability trades:
- Better Pro Am shows me what the Professionals and Amateurs are doing
- Better Sine Wave shows me price cycles and trends, and
- Better Momentum shows me buying and selling volume momentum
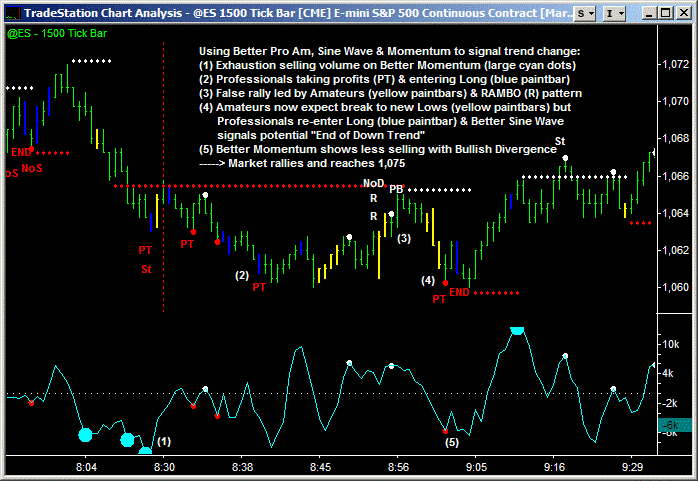
The chart above shows a trend change and how these 3 indicators came together:
- Better Momentum signaled exhaustion selling volume
- Professionals take profits on their Short trades and get Long
- An early false rally is led by the Amateurs and the lows are re-tested
- Amateurs are expecting a break to new lows but the Professionals step in
- Bullish divergence on Better Momentum coincides with an “End of Trend” warning signal on Better Sine Wave
The market ends up putting in a low at 1,060 and rallying to 1,075 before Professionals take profits and we get exhaustion buying volume.
How to Calculate Average Trade Size
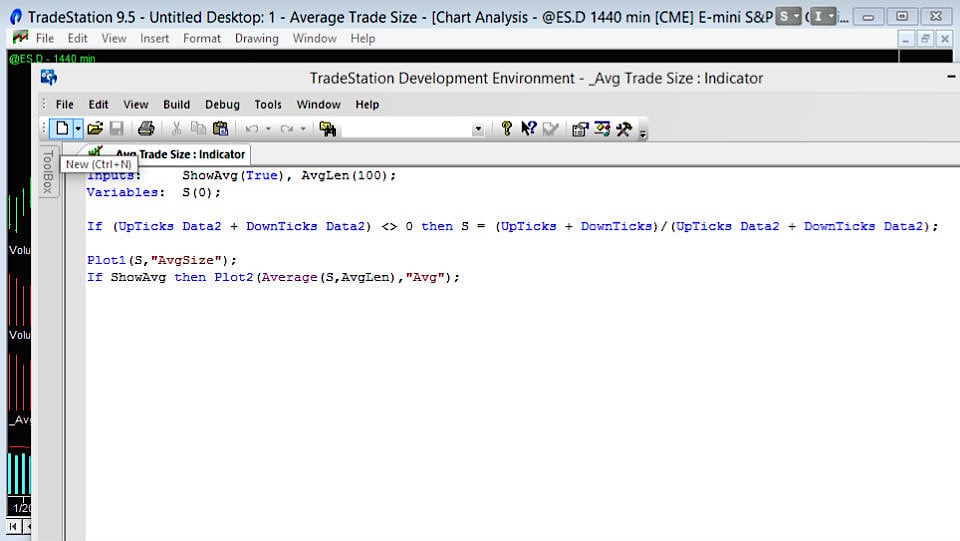
Whenever I put up a chart with the Average Trade Size indicator, the emails roll in. “How did you do that?” they ask. Well, this video has the answer. But don’t be surprised if you kick yourself once you’ve seen it. Nothing super secret or fancy dancy here.
And here’s a screen grab of the indicator code. In EasyLanguage I use “UpTicks + DownTicks” to calculate volume (or tick count). It’s more complicated than the “Volume” reserved word – but trust me, it’s more robust when switching between tick charts, minute charts and daily charts.
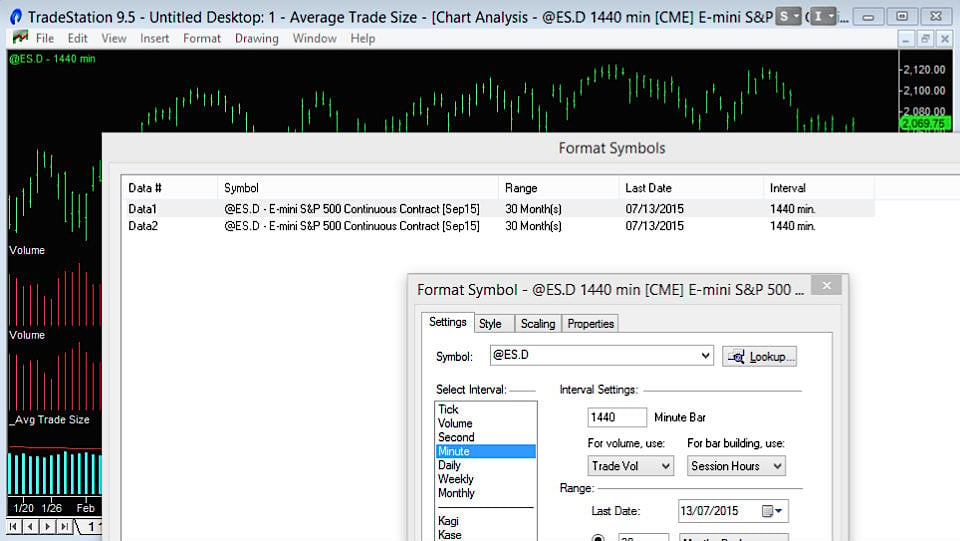
And if you don’t use TradeStation, here’s what you’re trying to recreate with your charts. Two data streams: one with “Trade Volume” and one with “Tick Count”. Then use an indicator to divide one data stream by the other.
Better Pro Am FAQs
No. Better Pro Am is dynamic and no fixed average trade sizes are coded into the indicator and there are no parameters that need to be optimized.
The indicator is not just for trading the Emini. You can use it on any market with volume data and the indicator will automatically calculate what levels to use for Amateur and Professional activity. Personally I hate optimized code and none of the ‘Better’ indicator input parameters need to be changed based on the market traded or market conditions.
What about the different average trade sizes for day and after-hour sessions?
At the end of the day session Better Pro Am will take a few bars to “re-calibrate” with the lower trade sizes in the after-hours. So a few Amateur yellow bars will show immediately after the close. Then things will get back to normal and Better Pro Am will start showing real Amateur and Professional activity.
The Better Pro Am PaintBars (blue and yellow bars) identify Professional and Amateur activity using average trade size. Professionals trade in size; Amateurs trade in singles and doubles. So analyzing average trade size directly identifies Professional and Amateur activity.
Better Volume infers Professional activity by looking for large volume but relatively small range bars – “High Churn” bars. The assumption is that Professionals can enter/exit without moving price significantly. Part of the reason they can do this is that they enter/exit at price extremes. Amateurs are seen on low volume bars.
In my personal trading I’ve switched 100% to Better Pro Am from Better Volume. Better Volume was/is a great volume indicator – I made a lot of money with it plus got recognition and website traffic by releasing it as a free indicator. But times change, trading methodologies evolve and it’s time to move on.
This is a TradeStation glitch/limitation – text and trend lines can only be plotted to the nearest minute, not second. When the market is moving quickly the signal text (R) is plotted at the nearest whole minute bar and not above or below the real signal (Amateur bar). Apologies, nothing Emini-Watch can do.
Summary
This article should have convinced you to:
- Use trade size to spot Professionals and Amateurs. The Better Pro Am indicators use a proprietary algorithm to analyse average trade size and identify Professional & Amateur activity. They work in any time frame (tick to monthly charts) and for any market (futures, stocks, forex, etc.), however, the Professional and Amateur PaintBars are best used on tick charts.
- Anticipate trend changes with Professional activity. Professionals can be seen active at trend changes, buying new lows and selling new highs. But Amateurs chase the trend, buying breakouts and selling breakdowns, highlighted by the RAMBO (“Reversal of Amateur Break Out”) volume pattern.
- Watch for volume patterns too. Leading into trend changes you’ll see Professional accumulation & distribution patterns like Stopping Volume, Profit Taking and No Demand/No Supply.
- Don’t use just one indicator. Use confirming indicators to identify high probability trades. In my trading I use a combination of 3 non-correlated indicators, this includes Better Pro Am.
- Upgrade from Better Volume. Lastly, in my own trading, Better Pro Am has now replaced Better Volume.
What people are saying about Better Pro Am
Better Pro Am really kicks ass. I have been able to decrease my trade signals and increase my win rate and that can and will make a lot of difference!
KB
The ProAM Blue bar is the GPS Compass for profits as the most powerful indicator I’ve ever seen and it changes my trading life! Thanks a million.
Anthony W.
I don’t know how you did it but once you understand the language of the ProAm and what they really represent you’re in business for life as a trader.
Robert G.
Just love the Better Pro Am, thanks so much. This morning made 4 small trades and all winners – knowing what the Pro’s are doing makes all the difference.
Herb C.
The blue bars Professional bars on YM and ZQ are great at tipping the market direction. Really works beautifully. Thanks again for all the work in building these indicators.
Rob B.
I think your Better Pro Am indicator is brilliant … It’s a really clever idea measuring the average trade size to check the Pro’s and Am’s. There is nothing else out there like it that I know of.
Mark L.
I am enjoying experimenting with Better Pro Am on the 6E Euro/Dollar contract data. It is a great indicator, vastly improving on Better Volume. The No Demand pattern is particularly deadly accurate. What a pleasure to find an indicator at a reasonable price, that is also well programmed and just darn well works!
Doug H.
I can’t believe how important the ProAm indicator has become to my trading strategy. It really is my make-or-break decision making tool for entering trades: No ProAm blue bars means no attempts to play the market for me. Doing that alone, I’m averaging a 66% success rate – and my 33% losses either come from a misread of professional intentions or a retracement opposite professional intentions hitting my stop loss before the professionals are proved right with the continuation.
Jil W.