Trading with Trend Lines - Emini-Watch.com
“The Big Money is in The Big Moves.”
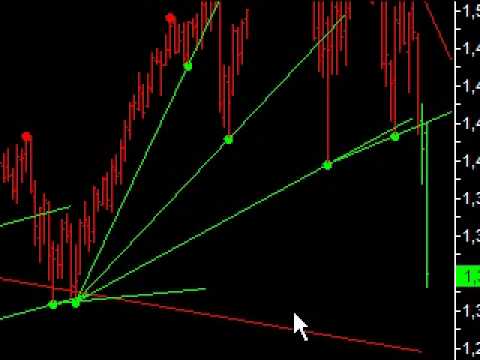
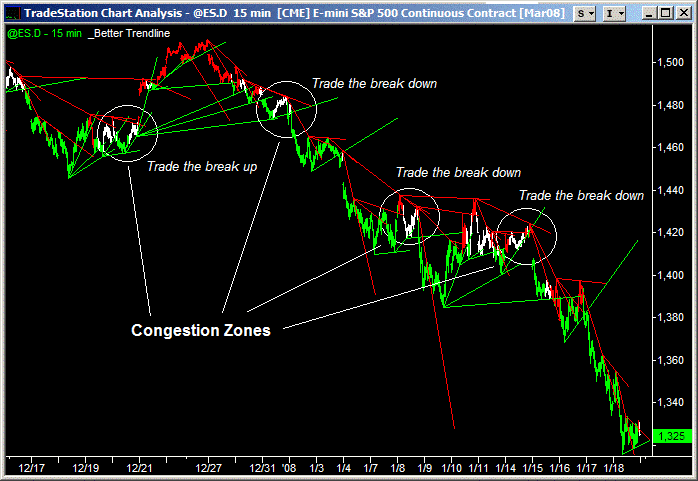
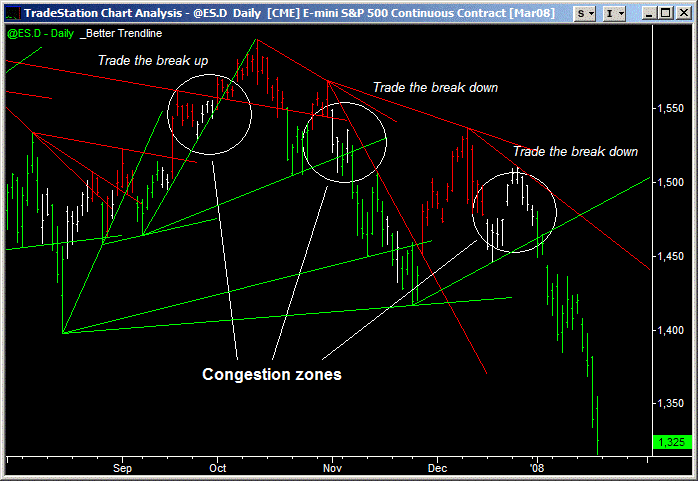
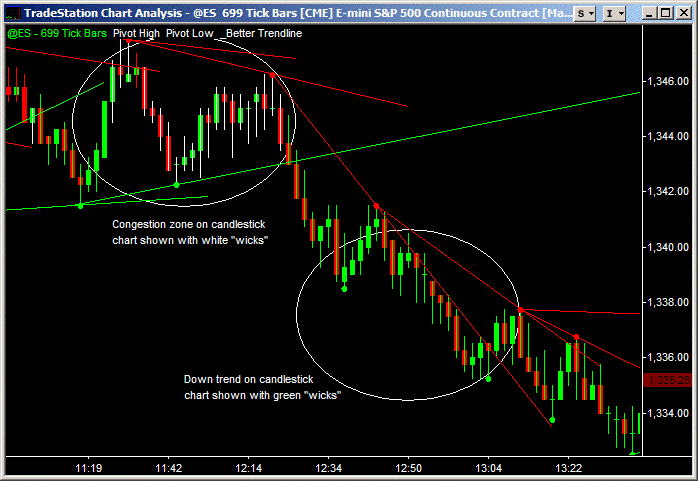
Better Trend Lines is a very simple and elegant indicator that signals uptrends, downtrends and market consolidation zones. Trade entries are signalled when the market breaks out of a consolidation zone, into a trending phase. Real breakouts will move fast and without a pullback, so trades are best entered “at market”.
Better Trend Lines indicator:
- Works on all TradeStation charts – any instrument, any timeframe
- Automatically plots rising and falling trend lines – eliminates the guesswork
- Highlights congestion zones – areas where large trend moves start
- Works on candlestick charts – candlestick “wicks” colored automatically
- Includes Trend Line Function – program your own Better Trend Line systems
- Protected TradeStation EasyLanguage (.ELD) code
More examples of Better Trend Lines indicator in action
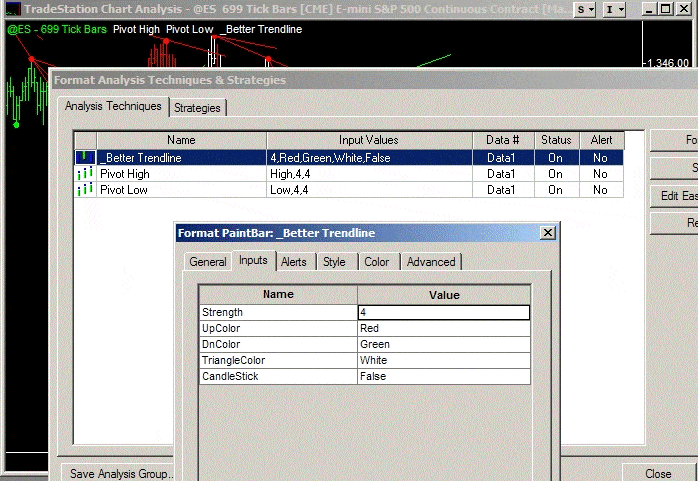
Note: For candlestick charts go Format > Inputs > Change CandleStick to True. Then go View > Chart Analysis Preferences > General > Untick “When a study paints a candlestick bar, paint the body & wick”.