The Better Sine Wave Indicator is unknown to the vast majority of traders. This amazes me – because if there were ONE indicator I’d recommend to traders to use, it would be the Better Sine Wave. Yes, it really is THAT good.
Here’s what some users of the Better Sine Wave Indicator have to say:
It may be the best indicator I ever bought. David B.
I paid for the Better Sine Wave indicator on my first trade. Michael L.
I am amazed at what this indicator can do. Victor H.
The Better Sine Wave Indicator is an improved version of John Ehler’s Hilbert Sine Wave, which uses a digital signal processing algorithm to measure the cyclical energy in a data stream of market prices. Its ability to differentiate between cyclical and trending price activity sets the Hilbert Sine Wave (and Better Sine Wave Indicator) apart. Read on to understand more.
Table of Contents
If you still have questions after watching the video or reading this article, get in touch as I’d love to keep adding your questions to this comprehensive guide.
The Hilbert Sine Wave is a unique indicator
The Hilbert Sine Wave was developed by John Ehlers and first published in his book “Rocket Science for Traders”. The indicator uses an algorithm, originally applied to digital signal processing, that measures the amount of cyclical energy in a stream of data, for example, a stream of market prices.
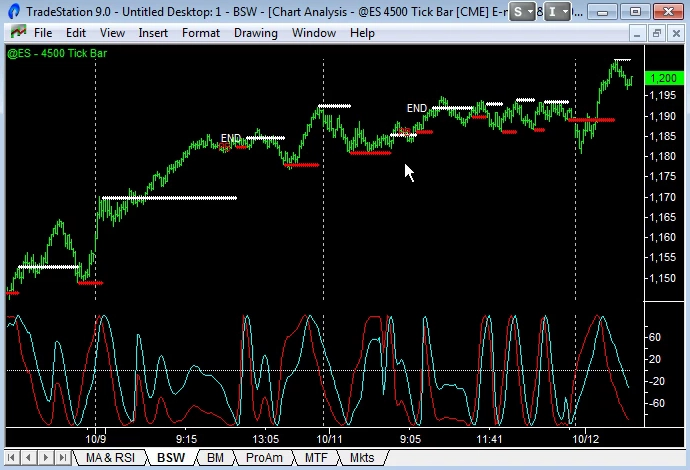
The indicator produces a sine wave plot, as shown in the bottom half of the Emini chart above. Two lines are drawn (blue and red) and crossovers signal cyclical turning points.
What makes this indicator unique is that it distinguishes between cyclical and trending price activity. During periods when the price activity is trending, and not displaying cyclical characteristics, the lines do not cross and the indicator does not plot the normal sine wave – the lines look “out of sync”.
Markets alternate between periods when price is range bound or cycling and periods when price is moving to a new level or trending. Cyclical periods are characterized by price bouncing off support or resistance levels and failed breakouts or “overshoots”. Trending periods are characterized by new highs or new lows and pull backs (PB) that then continue in the direction of the trend, until exhausted (END).
In this way, the Hilbert Sine Wave combines the best characteristics of an oscillator: signalling over-sold and over-bought in a cyclical range. As well as the best characteristics of a moving average: signalling the start and end of a trending move. For more reasons why not to use moving averages, check out: Ditch Your Moving Averages … They’re So 1956!
How is the Better Sine Wave Indicator … better?
I first came across the Hilbert Sine Wave 10 years ago and was hooked from the beginning – it seemed to describe market activity in any time frame much more elegantly than a moving average or Elliott wave series could.
Since then I’ve added to the raw cycle measuring part of the code and improved upon it – that’s why I call my version “better”. The Better Sine Wave includes:
- “Smart” support and resistance levels when price is cycling and in congestion
- Pull Back and End of Trend signals when price is in trending mode
- No cycle “glitches” when used with Forex data, and
- Input data smoothing using a smart algorithm
Today, I couldn’t trade without the Better Sine Wave – for me, it puts everything in context. Showing me what the market structure is – are we in consolidation and waiting to break out into a trend or are we in the middle of a trend and waiting for the market to top (or bottom) out.
Confirm Better Sine Wave Indicator turns with non-correlated indicators
A key skill when trading with the Hilbert Sine Wave is determining whether a cyclical turning point is valid or not. That is, will price “respect” the support or resistance level, or “overshoot” and turn into a trend move instead?
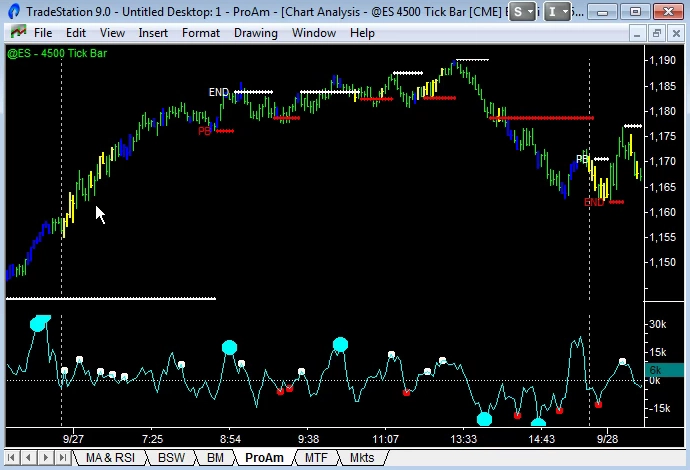
I use my 2 other non-correlated indicators to help make this decision. Better Momentum measures buying and selling volume; Better Pro Am identifies Professional and Amateur activity based on the average trade size.
As an example, the Emini chart above shows a top being made. Better Sine Wave has made a Pull Back to End of Trend sequence and the market then stalls in a cyclical range. The change into a down trend is confirmed by the following sequence:
- Exhaustion buying (large cyan dots) on Better Momentum
- Then bearish divergence (small white dots) showing weaker buying volume
- Professionals (blue up bars) taking profits on the highs
- Then Amateurs (yellow up bars) buying the highs and expecting the move to continue, only to be wrong footed
This same sequence of price, volume and average trade size is repeated time and again at market turning points, both bottoms and tops.
And use Hilbert Sine Wave on multiple times frames
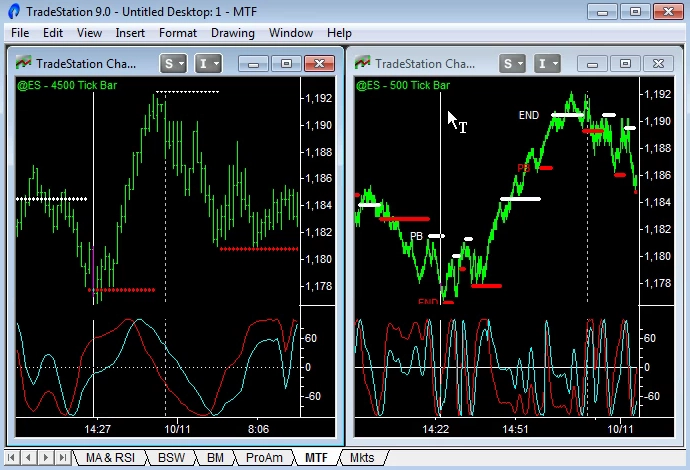
Then when these patterns using the Hilbert Sine Wave (along with volume momentum and average trade size indicators) occur simultaneously in two different time frames, the probability of a valid market turning point is greatly increased!
Trend moves in lower time frames will look like large cycle moves in higher time frames, as shown in the Emini 4,500 and 500 tick charts above. In the highest time frame (4,500 tick) we have a cyclical move up from 1,178 to 1,192 highlighted. In the lowest time frame (500 tick) the market has made a Pull Back to End of Trend sequence at the lows around 1,178 and then proceeds to make a mirror Pull Back to End of Trend sequence at the highs around 1,192.
The cyclical turns in the highest time frame is used to determine the overall trend. Then the lowest time frame is used to time entries. In my trading I use 3 time frames, each a multiple of 3 times the lower time frame:
- Day Trading: 500, 1,500 and 4,500 tick (500 x 3 = 1,500 and 1,500 x 3 = 4,500)
- Swing Trading: 45 min, 135 min and Daily (45 x 3 = 135 and 135 x 3 = Daily)
- Position Trading: Day, Week and Month (Day x 5 = Week and Week x 4 = Month)
- Or anything in between: 1 min, 3 min, 9 min or 5 min, 15 min, 45 min, etc.
When turning points in 2 of the 3 time frames coincide, the chances of a large range move are increased. Since the Better Sine Wave indicator can be used to predict cyclical turning points AND the end of trending periods, it is uniquely capable of being used in multiple time frame analysis.
Again, remember to look for confirmation from volume momentum and average trade size patterns to increase your winning percentage.
Hilbert Sine Wave works on all time frames & all markets
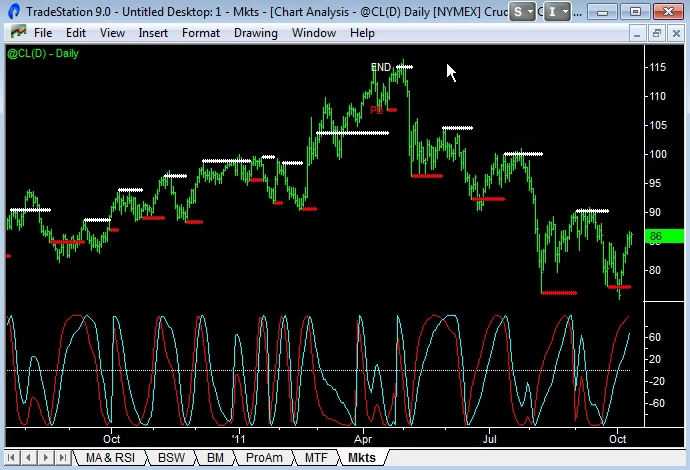
The beauty of the Better Sine Wave indicator, and the support and resistance levels it generates, is that it can be used to define market structure in any time frame:
- Tick bars
- Minutes
- Hourly
- Daily
- Weekly, and
- Monthly
And for any instrument or market:
- Futures
- Stocks
- FX
- Indices
- Options, etc.
The chart above shows the Better Sine Wave on a daily chart of Crude Oil – showing the same pattern of support/resistance lines and pull back/end of trend sequences.
This truly is a “universal” indicator.
Here are lots of Better Sine Wave Indicator examples
Summary
This article should have convinced you:
- The Better Sine Wave is a unique indicator – it combines the best characteristics of an oscillator as well as the best characteristics of a moving average.
- The “Better Sine Wave” is an improved version of John Ehler’s Hilbert Sine Wave – it defines market structure with support and resistance levels during cyclical periods; and breakouts, pullbacks and end of trend signals during trending periods.
- Market turning points and high probability trades can be identified using the Hilbert Sine Wave in combination with volume momentum and average trade size analysis.
- Trend moves in a lower time frame are cycle moves in a higher time frame – a key concept when trading with multiple time frames. Again, this can be used to confirm turning points and identify high probability trades.
- The “Better Sine Wave” indicator works in any time frame (tick to monthly charts) and for any market (futures, stocks, forex, etc.).
What people are saying about Better Sine Wave
Amazing
The Better Sine Wave SR indicator has an amazing way of catching tops and bottoms.
Bob V.
Never trade again without it!
Better Sine Wave is the best indicator I have come across. Will never trade again without it!
Ganesh B.
Better Sinewave is close to a holy grail indicator
Barry, I love your Better Sinewave indicators and bought them several years ago. I think your Better Sinewave is close to a holy grail indicator. Thanks for all you do.
Doug C.
Verrrry nice!
Verrrry nice! Very, very nice, I must say. I’ve never seen Ehlers’ Sine Wave combined with what I would call a quasi-Elliott interpretation. What a marvelous idea!
Frank J.
Better Sine Wave is amazing
Better Sine Wave is amazing. I’m using the 1500 tick and waiting for S & R breaks followed by break of breaks. Sometimes the S & R is broken but there’s no follow thru. So, I wait for the high/low after the break to be broken by 2 ticks before I consider entering.
Randy G.
Shows major inflection points
Barry, I just wanted to mention how impressed I am with the Better Sine Wave SR indicator. The Better Sine Wave SR shows major inflection points in the market that other indicators just don’t pick up.
George D.
Picks a ton of great trades
Love the Better Sine Wave indicator on tick charts – it picks a ton of great trades. I have been investing/trading for 15 years and your indicators have re-lit the fires under my feet. Great work.
John R.
Trading significantly better
Thanks for your Better Sine Wave product/documentation/videos. I’m getting a much better feel for the ES market and trading significantly less – but significantly better and with more confidence ?
Rick F.
Amazed at what this indicator can do
I am amazed at what this indicator can do. It really does work for all time frames and all markets. I have been watching the Better Sine Wave indicator on the ER2 1,000 share volume bar chart … just amazing! I use it to scalp 1-1.5 point trades or sometimes to scale out. I had never even heard of this indicator until I went to your site! Great work Barry.
Victor H.
Breakthrough in my day trading
I wanted you to know that your Better Sine Wave indicator has been a breakthrough in my day trading. I am consistently pulling 2-4 pts per contract a day out of the market. I thought you might enjoy hearing from a satisfied customer. You have helped make day trading fun for me again.
Isaac M.