Tick Charts are one of my “secret weapons” and this article explains why.
Tick Charts are not very well known and can be confusing. From time to time I get questions about Tick Charts and yesterday’s email from Ken was typical:
I’ve been scouring the Internet for information on tick charts and their ins and outs – but have found nothing useful. Can you please point me to a good source of information with a decent explanation? Ken
Well I consider myself a little bit of an expert on Tick Charts, so here goes. Use the links below to jump to a particular section:
What is a Tick Chart?
A Tick Chart draws a new bar after a set number of trades, for example after every 500 trades. Conventional (i.e. time-based) charts draw a new bar after a set period of time, for example after every 5 minutes.
Don’t get confused with the NYSE TICK Index (or $TICK in many charting programs). The NYSE TICK Index is a totally different thing. It measures the number of stock issues trading on an uptick versus a downtick. A Tick, by contrast, is just a trade and 1 Tick = 1 trade.
I much prefer Tick Charts over conventional, time-based charts. Here are my 5 reasons why.
5 Advantages of Tick Charts
#1 Tick Charts allow you to follow the Professionals
The Emini is a perfect trading vehicle because we know the number of contracts in each individual trade. So on a Tick Chart when we plot volume we see the total number of contracts traded during those last say 100 trades. The relative size of the volume histogram shows us the average trade size. Let’s take an example.
If during the last 100 trades the average number of contracts in each individual trade was 2, the volume histogram would show a value of 200. However, if during the last 100 trades the average number of contracts in each individual trade was 25, then the volume histogram would show a value of 2,500. So if the volume histogram is low we are seeing Amateurs trading and if the volume histogram is high we are seeing Professionals.
The 2,097 Tick Chart above has some of the high value bars highlighted – these show large average trade sizes or Professionals. As you can see, you want to follow the Professionals. They were buying the dips and shorting the rallies.
#2 Tick Charts allow you to fade the Amateurs
Similarly, looking out for low value bars allows you to identify what the Amateurs are doing. The 2,097 Tick Chart above is exactly the same as the previous chart but with some of the low value bars highlighted. These show small average trade sizes or Amateurs. As you can see, you want to fade (i.e. do the opposite of) the Amateurs. They were shorting the dips and buying late into the rallies.
Now I think that information alone would be reason enough to use Tick Charts, but there’s more …
#3 Tick Charts let you get a jump on breakouts
If you’re waiting for the close of a bar to enter a trade, say a breakout, a Tick Chart will get you in earlier. The Emini trading chart above illustrates the point. The Emini spiked up on FOMC-related news. Using a Tick Chart you could see the surge in activity and enter at the bar’s close – say 779. With say a 3 minute chart the entry on close would have got you in closer to 784 – or 5 points worse off!
Hi Barry, I used to use 1 min, 5 min, 15 min charts etc. but found time to be inadequate due to changes in volatility. I would be profitable for 2 months and then boom, volatility spikes up and all of sudden, my trading is not good. Switching to 1500 tick and 4500 tick has completely masked the volatility differences and allows me to trade more consistently regardless of the volatility. John G.
#4 Tick Charts let you “see” more cyclical information
A Tick Chart will also allow you to “see” more trade information and work particularly well with cycle analysis. In the example above, the Better Sine Wave, my preferred cycle analysis tool, was able to pick out a Pull Back long entry point in the 2,097 Tick Chart. However, with the 3 minute chart the Pull Back was completely missed.
#5 Tick Charts compress low activity periods
Lastly, a Tick Chart compresses low activity periods, like lunch time, after-hours and overnight trading. This reduces whipsaws and allows more “continuous” analysis between days, with trades setting-up pre-open on a Tick Chart. Or fewer false break-out trades during lunch time.
What Tick Chart settings to use
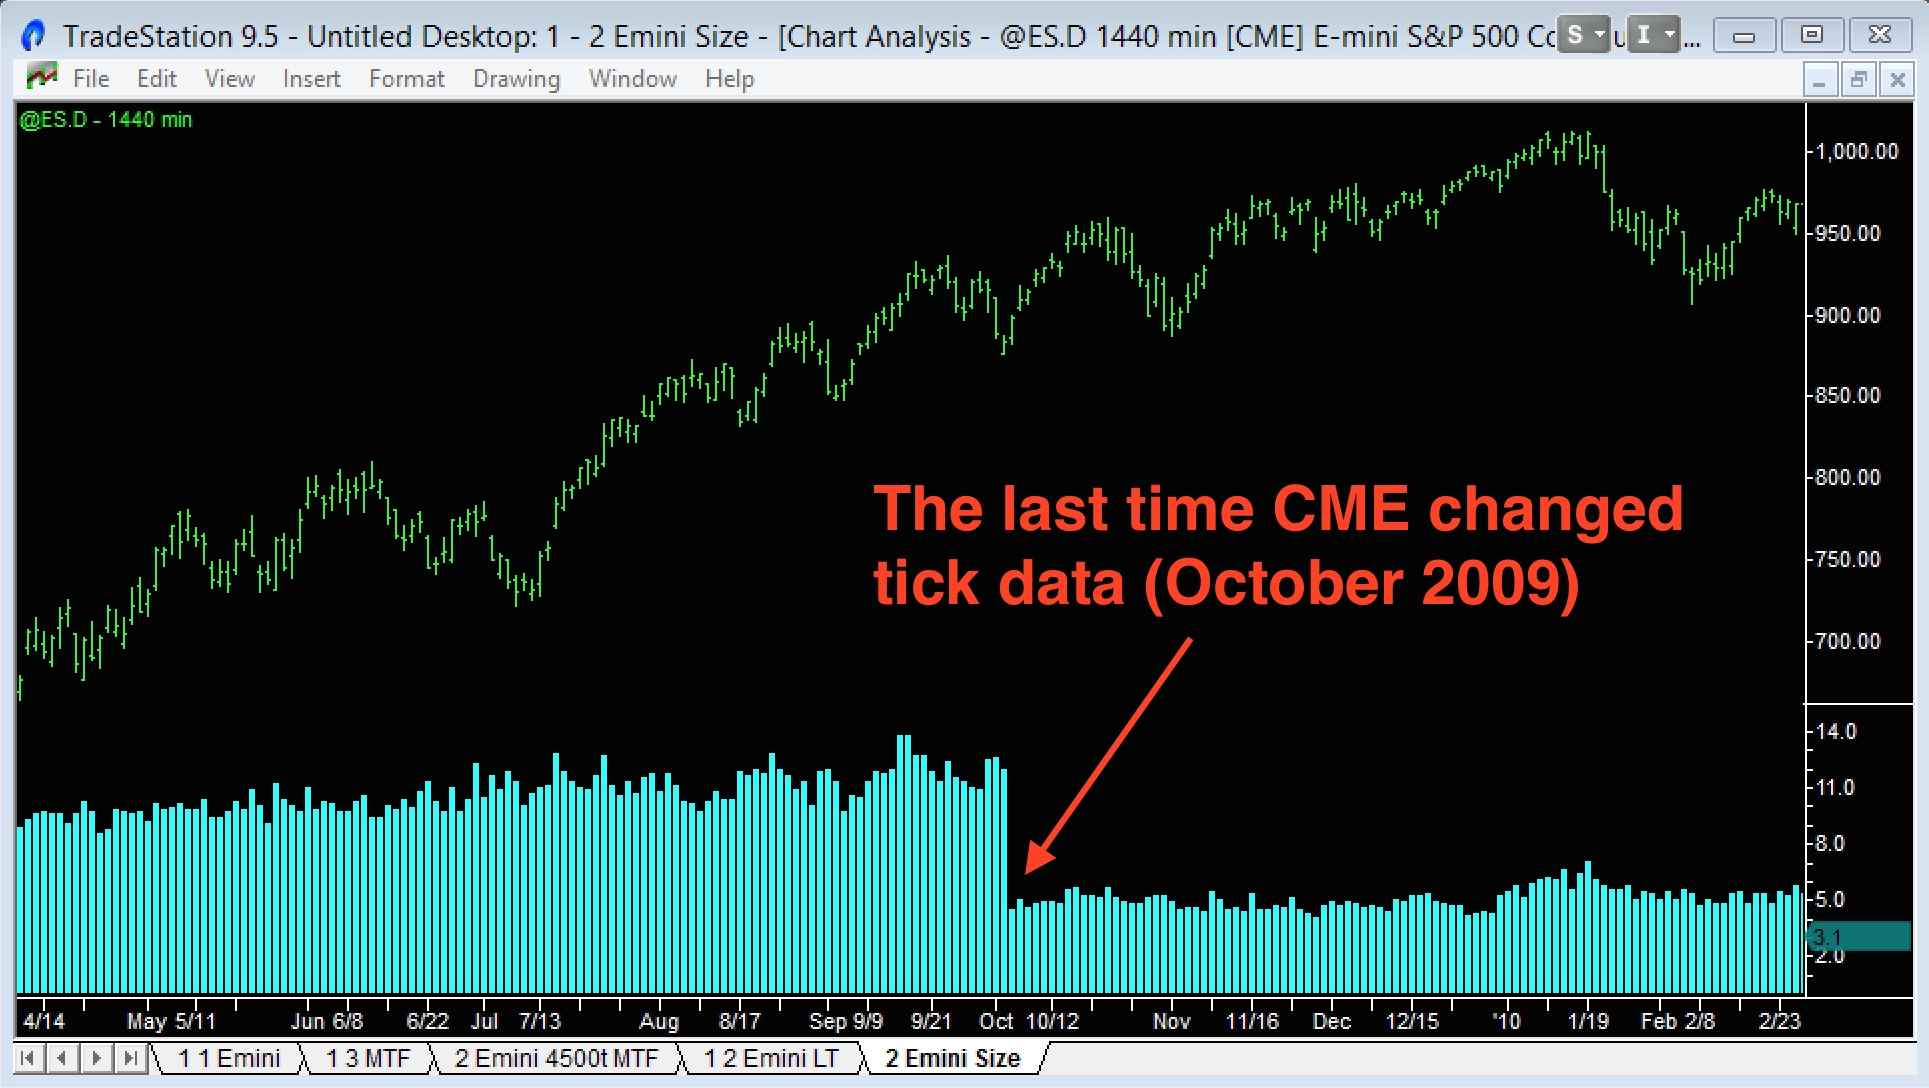
Over the years the CME has changed their definition of a Tick (or trade) in the Globex data feed. And at times this has created some anxiety for traders who rely on Tick Charts.
If a buyer steps in and picks up 3 orders each of 5 contracts sitting at the Ask, he is viewed as the ‘aggressor’ and in a ‘bundled‘ data feed this would be shown as: 1 trade for 15 contracts done at the Ask. In an ‘un-bundled‘ data feed this would be shown as: 3 trades each for 5 contracts done at the Ask.
In October 2009 the CME “un-bundled” trades, resulting in the average trade size dropping from approx. 11 to 5 contracts (see the chart above). Before the change my Emini chart setup used 233, 699 and 2,097 Tick Charts. 233 is a Fibonacci number and that’s why it was my starting point. After the change I switched to my current chart settings of 500, 1,500 and 4,500 Ticks.
In December 2014 the CME announced even more changes – an update called MDP 3.0. It took the data feed providers all of 2015 to sort out how to handle this update and there were some heart stopping moments along the way. In the end it was all a ‘storm in a teacup’ and there was no need to change the 500, 1,500 and 4,500 Tick Chart setup.
You can read some of the details in these update panels below:
Best Tick Chart for Emini day trading
The three best Tick Charts for Emini day trading are the 500 Tick, 1,500 Tick and 4,500 Tick Charts. I use these in my multiple time frame (MTF) analysis of the Emini. The lowest timeframe (500 Tick) is great for timing an entry or exit. The intermediate timeframe (1,500 Tick) is great for identifying the trend direction. And the highest timeframe (4,500 Tick) allows you to see the big picture.
Best Tick Chart for Forex trading
Tick Charts are now possible for trading Forex.
With “traditional” cash Forex charts we only know the number of trades during a period of time and not the number of contracts traded. So on a Tick Chart when we plot volume there is no trade volume size. If you want volume information on a cash Forex chart you’ll have to stick with conventional time-based charts and plot Tick count as a proxy.
However, there is another option – futures Forex contracts traded on the CME. These contracts have grown quickly and are now large enough that they are representative of what happens in the cash Forex market. The advantage of these futures contracts is that complete volume data is available and Tick Charts work great.
There’s more information on using the ‘Better’ series of indicators on Forex charts here.
You will also need to adjust your tick chart settings for Forex contracts based on the relative activity of that contract. For example, the Euro is the most liquid Forex market and the 500 Tick, 1,500 Tick and 4,500 Tick Charts work well. The Aussie Dollar and Japanese Yen are less actively traded and for these contracts the 300 Tick, 900 Tick and 2,700 Tick Charts are best.
Tick Charts on different charting platforms
No two Tick data feeds are the same.
This is why you’ll never get 2 Tick Charts using different data feeds to match up exactly. On time-based charts, for example a 5 minute chart, there’s not normally a problem. The data from the exchange is time-stamped and your charting platform uses this to draw the bar.
However, with a Tick Chart, new bars are drawn based on the number of trades that have been completed – and this trade count can be:
- Filtered by the data feed provider
- Set to start re-counting at different starting points (e.g. midnight, open, etc.)
- Aggregated to reduce bandwidth requirements by the data feed provider
- Missing trades because of momentary Internet disconnects
- Processed out-of-sequence because of multi-threading on your computer, etc.
Frustrating – I know. But that’s life in the big city. However, for me the advantages of a Tick Chart far outweigh this negative.
Tick Charts and TradeStation
I get a lot of emails from traders asking why their volume indicators don’t look right on a TradeStation Tick Chart. For example, volume histograms that are all the same height. This is easily fixed.
Now the volume indicator on your Tick Chart will reference the trade volume data instead of the Tick count data.
If your Tick Charts are slow to load, your symbol data cache might have been corrupted or become bloated. The solution is to re-build your cache – I do this every 2 to 3 weeks or when I notice my Tick Charts are slow to load. This article on TradeStation charts explains the steps for re-building your cache.
Tick Charts and TradingView
TradingView (developed by the makers of MultiCharts) is the future of charting software. What makes it different is that it is 100% web-based – it’s not a stand-alone piece of software that has to be coded for Windows or MacOS and installed on your laptop. You open your web browser and access the TradingView charts and indicators.
However, TradingView is not ready for “professional” trading. It has great coverage of almost all instruments and exchanges (including all CryptoCurrencies). But it has two failings. One is that the data can change when you re-load a chart in real-time. This is almost a fatal flaw.
Secondly, Tick Charts are not yet available on TradingView. This feature has been requested many times, and TradingView has promised it is in the works. However, as of March 2020, Tick Charts are unavailable on TradingView.
Tick Charts and Interactive Brokers
The Interactive Brokers (IB) data feed available via their Trader Workstation Software (TWS) is not a true Tick-by-Tick data feed. IB provides snapshots of the trade data several times a second with an aggregate of the trades that took place during that interval. As a result, time-based charts (e.g. 5-minute charts) will be correct; however, a Tick Chart constructed using IB data will not.
Summary
This article should have convinced you to use Tick Charts:
- Professional and Amateur activity can be seen. With a Tick Chart, you can judge the average trade size and identify the Professionals and Amateurs.
- The disadvantages of time-based charts are overcome. Tick Charts help you get a jump on breakouts, let you “see” more cyclical information and compress low activity periods.
- Tick Charts are now possible for Forex trading. Getting complete volume data has always been a problem for Forex. The CME futures contracts for Forex are the answer.
- Tick Charts will never match between different data providers. This is just a fact of life. It’s not ideal but it should not dissuade you from using Tick Charts.
I hope you found this article about Tick Charts helpful.