Most traders ignore volume. Big mistake! Big! Huge!
Volume has to be the most underrated market variable used in technical analysis. But if you know how to analyze and interpret it, you’ll be able to see market turning points develop and anticipate pullbacks and trend changes.
You can figure out whether the Professionals are buying or selling by analyzing:
- Volume transacted at the bid or the ask
- High to low range of the bar, and
- Average trade size.
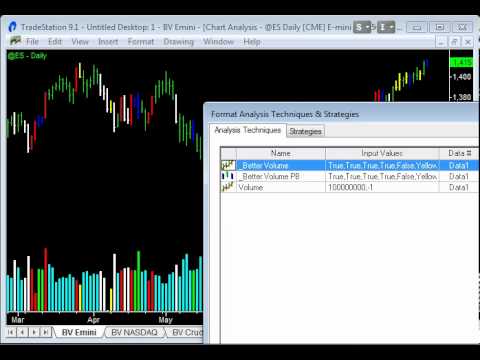
The Better Volume indicator improves on your typical volume histogram by coloring the bars based on 5 criteria:
- Volume Climax Up – high volume, high range, up bars (red)
- Volume Climax Down – high volume, high range, down bars (white)
- High Volume Churn – high volume, low range bars (green, PaintBar blue)
- Low Volume – low volume bars (yellow)
- Volume Climax plus High Volume Churn – both the above conditions (magenta)
When there are no volume signals the default histogram bar coloring is cyan. The Better Volume indicator also comes in a PaintBar version, so you can see the coloring on the price bars themselves.
Better Volume Indicator: Volume Climax Up
Volume Climax Up bars are identified by multiplying buying volume (transacted at the ask) with range and then looking for the highest value in the last 20 bars (default setting). Volume Climax Up bars indicate large volume demand that results in bidding up prices. The default setting is to color the bars red.
Volume Climax Up bars are typically seen at:
- The start of up trends
- The end of up trends, and
- Pullbacks during down trends.
The beginning of an up trend is almost always marked by a Volume Climax Up bar. This shows that the buyers are anxious to get on board and large volume enters the market and bids up prices quickly. A valid breakout should be followed by more buying but occasionally the low of the Volume Climax Up bar is tested.
Market tops are also characterized by Volume Climax Up bars often with High Volume Churn and/or Low Volume test patterns. Changes in trend usually take a while to develop, so don’t be suckered in too soon – wait for the market to become exhausted. A useful signal to watch for is the Low Volume bar – this shows that finally there is no demand and the market is likely to stop advancing.
During a down trend, pullbacks are often characterized by Volume Climax Up bars. These show short covering or traders calling a bottom too quickly. As soon as this Climax volume declines the down trend is likely to resume. Continuation of the down trend is confirmed when the low of the Volume Climax Up bar is taken out.
Better Volume Indicator: Volume Climax Down
Volume Climax Down bars are essentially the inverse of Volume Climax Up bars.
Volume Climax Down bars are identified by multiplying selling volume (transacted at the bid) with range and then looking for the highest value in the last 20 bars (default setting). Volume Climax Down bars indicate large volume supply that results in pushing down prices. The default setting is to color the bars white.
Volume Climax Down bars are typically seen at:
- The start of down trends
- The end of down trends, and
- Pullbacks during up trends.
The beginning of a down trend is almost always marked by a Volume Climax Down bar. This shows that the sellers are anxious to get on board and large volume enters the market and pushes down prices quickly. A valid breakdown should be followed by more selling but occasionally the high of the Volume Climax Down bar is tested.
Market bottoms are also characterized by Volume Climax Down bars often with High Volume Churn and/or Low Volume test patterns. Changes in trend usually take a while to develop, so don’t be suckered in too soon – wait for the market to become exhausted. A useful signal to watch for is the Low Volume bar – this shows that finally there is no supply and the market is likely to stop declining.
During an up trend, pullbacks are often characterized by Volume Climax Down bars. These show profit taking or traders calling a top too quickly. As soon as this Climax volume declines the up trend is likely to resume. Continuation of the up trend is confirmed when the high of the Volume Climax Down bar is taken out.
Better Volume Indicator: High Volume Churn
High Volume Churn bars are identified by dividing volume by the bar’s high to low range and then looking for the highest value in the last 20 bars (default setting). High Volume Churn bars indicate profit taking, new supply entering the market at tops or new demand entering the market at bottoms. The default setting is to color the volume histogram bars green and the price PaintBars blue.
High Volume Churn bars are typically seen at:
- The end of up trends
- The end of down trends, and
- Profit taking mid-trend.
When Volume Churn is high it indicates demand is being met by new supply at tops or supply is being met by new demand at bottoms – in effect, price is not able to advance as new supply or demand enters the market. Hence the bar’s high to low range is low.
Maybe one of my subscribers says it better than I can:
I like to think of the High Volume Churn bars as ‘brakes’. It’s like hitting the brakes – usually, the car will stop shortly thereafter (1-2 points), and then turn around. At other times, however, the momentum is so great that all you get is a pause and then the market just continues going in the same direction! Unfortunately, sometimes it is hard to tell which outcome will occur. Then you just need common sense. Neil F.
Occasionally Volume Climax (up or down) and High Volume Churn bars coincide and these bars are colored magenta.
A word of caution with intra-day charts. High Volume Churn often appears on the last bars of the trading day. This does not necessarily represent a possible turning point, but is more likely just to be high volume from day traders closing out positions.
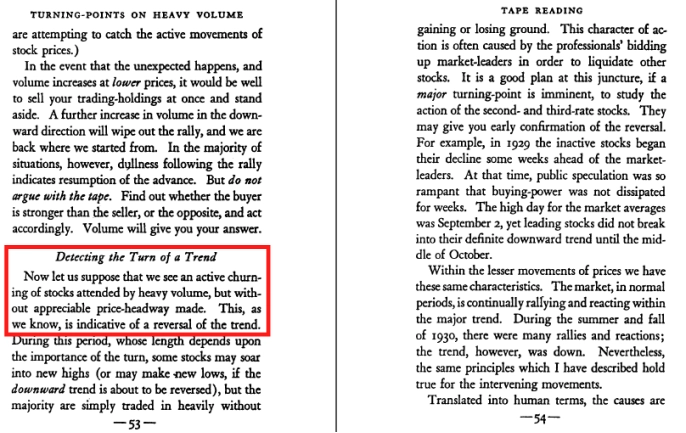
And lastly a bit of history and a screenshot from Humphrey B. Neill’s 1931 classic on reading the tape. In this section he talks specifically about tops being marked by high volume and no progress – high volume churn. HT to John A. for pointing me in the direction of this brilliant book. Darn, and I thought I’d coined the term 🙁
Better Volume Indicator: Low Volume
Low Volume bars are identified by looking for the lowest volume in the last 20 bars (default setting). Low Volume bars indicate a lack of demand at tops or a lack of supply at bottoms. The default setting is to color the bars yellow.
Low Volume bars are typically seen at:
- The end of up trends
- The end of down trends, and
- Pullbacks mid-trend.
Low Volume bars are my favourite volume indicator signal. They show what the amateurs are doing on tick charts. They are also very useful confirming indicators of a change in trend direction when the market is testing a top or bottom.
Better Volume Indicator: TradeStation EasyLanguage Code
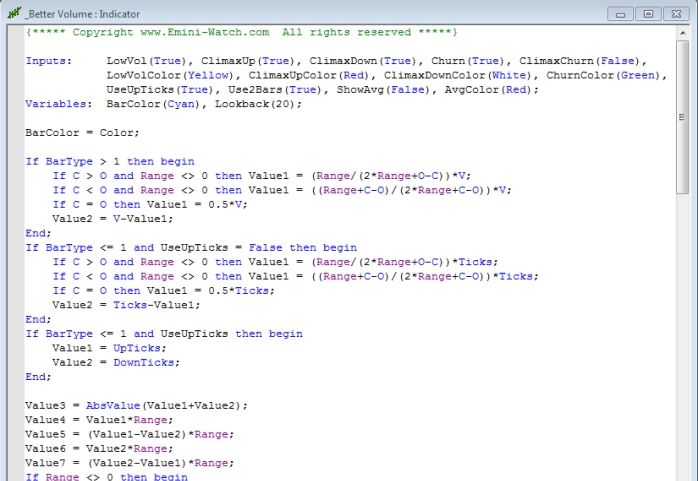
A snippet of the TradeStation EasyLanguage code for the Better Volume indicator is shown above. By default, intra-day charts use the “UpTicks” and “DownTicks” data available within TradeStation. For daily, weekly or monthly charts an estimate of the buying and selling volume is calculated based on the bar’s open, high, low and close.
Please note, the TradeStation EasyLanguage term “UpTicks” will call the total volume transacted on an uptick/at the ask. Similarly, the term “DownTicks” will call the total volume transacted on a downtick/at the bid. Total volume for an intra-day bar can be deduced by adding together “UpTicks” and “DownTicks”. This terminology may not be the same for other charting platforms – so don’t bug me about it!
Summary
| Bottom | Start Up Trend | Up Trend Continue | Top | Start Down Trend | Down Trend Continue | Indicator Color | |
| Volume Climax Up | Yes | Yes | Yes | Red | |||
| Volume Climax Down | Yes | Yes | Yes | White | |||
| High Volume Churn | Yes | Yes | Green/Blue | ||||
| Hi Vol Churn + Climax | Yes | Yes | Magenta | ||||
| Low Volume | Yes | Yes | Yes | Yes | Yellow |
The table above is a quick reference guide that shows what volume indicator signals to watch for at different stages of the market:
- Market tops are characterized by Volume Climax Up bars, High Volume Churn and Low Volume Up bars (also called Testing).
- Market bottoms are characterized by Volume Climax Down bars, High Volume Churn and Low Volume Down bars (Testing).
- Pullbacks, in either up or down trends, are similar to market topping or bottoming patterns, but shorter in duration and with simpler volume patterns.
Remember, this method of identifying turning points using volume is even more powerful when combined with non-correlated indicators, such as the Hilbert Sine Wave.
Better Volume Indicator for TradeStation, NinjaTrader, etc.
Just click the buttons below to download the free Better Volume indicator for various trading platforms: TradeStation, NinjaTrader, ProRealTime, MultiCharts.net, TradingView and the EasyLanguage code in text format. With the NinjaTrader download, please note you need to unzip the file first before importing.
Click this link for more free indicator code.
What people are saying about the Better Volume indicator
Rocks!
Better Volume rocks!
Serger
The best volume indicator bar none
The Better Volume indicator, in my opinion, is the best volume indicator bar none.
Elliott Wave, NinjaTrader Forum
The most valuable indicator
Better Volume is really great … I got rid of other unnecessary and useless indicators … Thank you for Better Volume, the most valuable indicator to me.
Mirko M.
Very powerful stuff!!!
My trading is going much better now that I understand using Better Volume with Better Sine Wave on multiple time frames. Very powerful stuff!!!
Peter S.
Never been so attuned with an indicator immediately
Again, much appreciation for this excellent indicator! In 20 years of trading I’ve never been so attuned with an indicator immediately.
P. Trader
Trades walk right up and ask to be taken
Better Volume is superb, astonishing, it knows the market … When elephants walk across your front lawn they leave footprints … Don’t have to look for trades, trades walk right up and ask to be taken.
Joel
Best indicator around for volume
Thank you for the Better Volume Indicator. It is by far the best indicator around for volume.
Giacomo
Up 66% in 6 months
I love the Better Volume Indicator. I have been consistently profitable basing my swing trade entries off the low volume yellow bars in your Better Volume Indicator (up 66% in 6 months).
Brent F.
Performs awesomely
Thank you so much for the Better Volume indicators. I add to it the Donchian Channel and the Aroon indicator tho confirm buy or sell as well as taking profit and it performs awesomely. By the way I’m a 20 years veteran trader. You’re doing a great job.
Sicco
WOW. I am absolutely blown away
WOW. All I can say is WOW. I am absolutely blown away at your Better Volume indicator. I have been working on something similar and tweaking it over the years and I thought I had something novel!! Side-by-side though, yours is outperforming mine so far this week … VERY nice and quite impressive. Fantastic work, glad I found your site!
Todd
This is truly a million dollar indicator
Boy if people really would understand the power of this indicator. Not only does it show where smart money is accumulating and distributing it also is fantastic at identifying where bots are absorbing transactions. This is truly a million dollar indicator. Volume is the only thing that precedes price, the ONLY thing. And being able to identify absorption is great. Even the Smart money and bots can not hide what they are doing.
Ray P.
Your Better Volume indicator is amazing
Oh my freaking GOD … your Better Volume indicator is amazing. It takes time to get to understand and trade and tens of thousands lost on my part but HOLY COW … I FINALLY have it figured and I can’t thank you enough for helping traders with your effort … this is a little secret weapon that keeps a trader on his game. Please, don’t let this fall into the wrong hands :~) God bless you for your efforts and sharing your work.
Big John